Solana price has fallen to a multi-year low as a major corporate holder moved $31.9 million worth of SOL to Coinbase Prime, adding to fears that whales are reducing exposure during the market selloff.
Summary
- Solana price fell to a multi-year low near $60 as whale transfers, ETF outflows, and market-wide liquidations intensified selling pressure.
- Forward Industries moved $31.9 million worth of SOL to Coinbase Prime, fueling concerns that large holders may be reducing exposure.
- Technical indicators and liquidation data suggest a break below current support could expose SOL to the $55–$50 region.
According to data from crypto.news, Solana (SOL) traded near $62 on June 6 after briefly falling to the $60 area. The token has lost roughly 24% over the past week, more than 30% over the past month, and about 50% since the start of the year as traders continued reducing exposure to risk assets amid a broader crypto market selloff.
Large holders have added to concerns about the market’s outlook. According to blockchain analytics platform Lookonchain, Forward Industries transferred 455,784 SOL worth approximately $31.9 million to Coinbase Prime after a month of inactivity.
Since adopting a Solana treasury strategy in September 2025, the company has spent roughly $1.59 billion acquiring 6.83 million SOL at an average price of $232. Lookonchain estimates those holdings are now worth about $458.6 million.
The transfer does not confirm an outright sale, but traders frequently monitor deposits to institutional trading venues for signs that large investors may be preparing to reduce positions. The transaction arrived as SOL traded near its lowest levels since 2024 and reinforced concerns that other treasury holders could also move to protect capital if market conditions worsen.
Derivatives markets have already undergone a sharp deleveraging event. CoinGlass data shows more than $1.5 billion in crypto positions were liquidated over the past day, with long traders accounting for most of the losses. Solana absorbed a significant share of the damage as leveraged bullish positions were forced to close into a falling market.
Institutional demand has also weakened. SoSoValue data showed that U.S. spot Solana ETFs recorded net outflows after several weeks of inflows. The reversal came as investors reassessed exposure to digital assets following Bitcoin’s decline below the key $60,000 support level.
Outside crypto, financial markets have become increasingly defensive. A stronger-than-expected U.S. jobs report reduced expectations for Federal Reserve rate cuts, while renewed geopolitical tensions in the Middle East pushed oil prices higher and revived inflation concerns.
Rising Treasury yields prompted another rotation away from speculative assets, weighing on altcoins across the market.
Solana approaches a critical long-term support zone
The weekly chart shows Solana testing a major support area near $51.5 after months of persistent selling pressure. The level served as an important breakout zone during late 2023 and now represents the most significant support remaining on the higher-timeframe chart.
Trend indicators continue to favor sellers. Solana remains well below its major moving averages, while the weekly MACD sits beneath the zero line with both MACD and signal lines still trending lower. Aroon indicators also remain bearish, with the Aroon Down reading returning to 100 and the Aroon Up trailing beneath it.
Commenting on the bearish market setup, crypto analyst Jack Adams argued that Solana may revisit lower levels before finding a durable bottom.
“I am almost certain $SOL is heading back to retest $67-$58 once more before reversing into $120-$175 this year.”
According to the analyst, previous demand zones between $58 and $67 could attract longer-term buyers despite the ongoing market weakness.
Weak support below current levels raises $50 risk
CoinGlass liquidation heatmap data identifies the largest concentration of leveraged positions between $70 and $75, with a particularly dense cluster near $74. Those levels could attract price during any relief rally, although they now represent significant resistance after the recent breakdown.
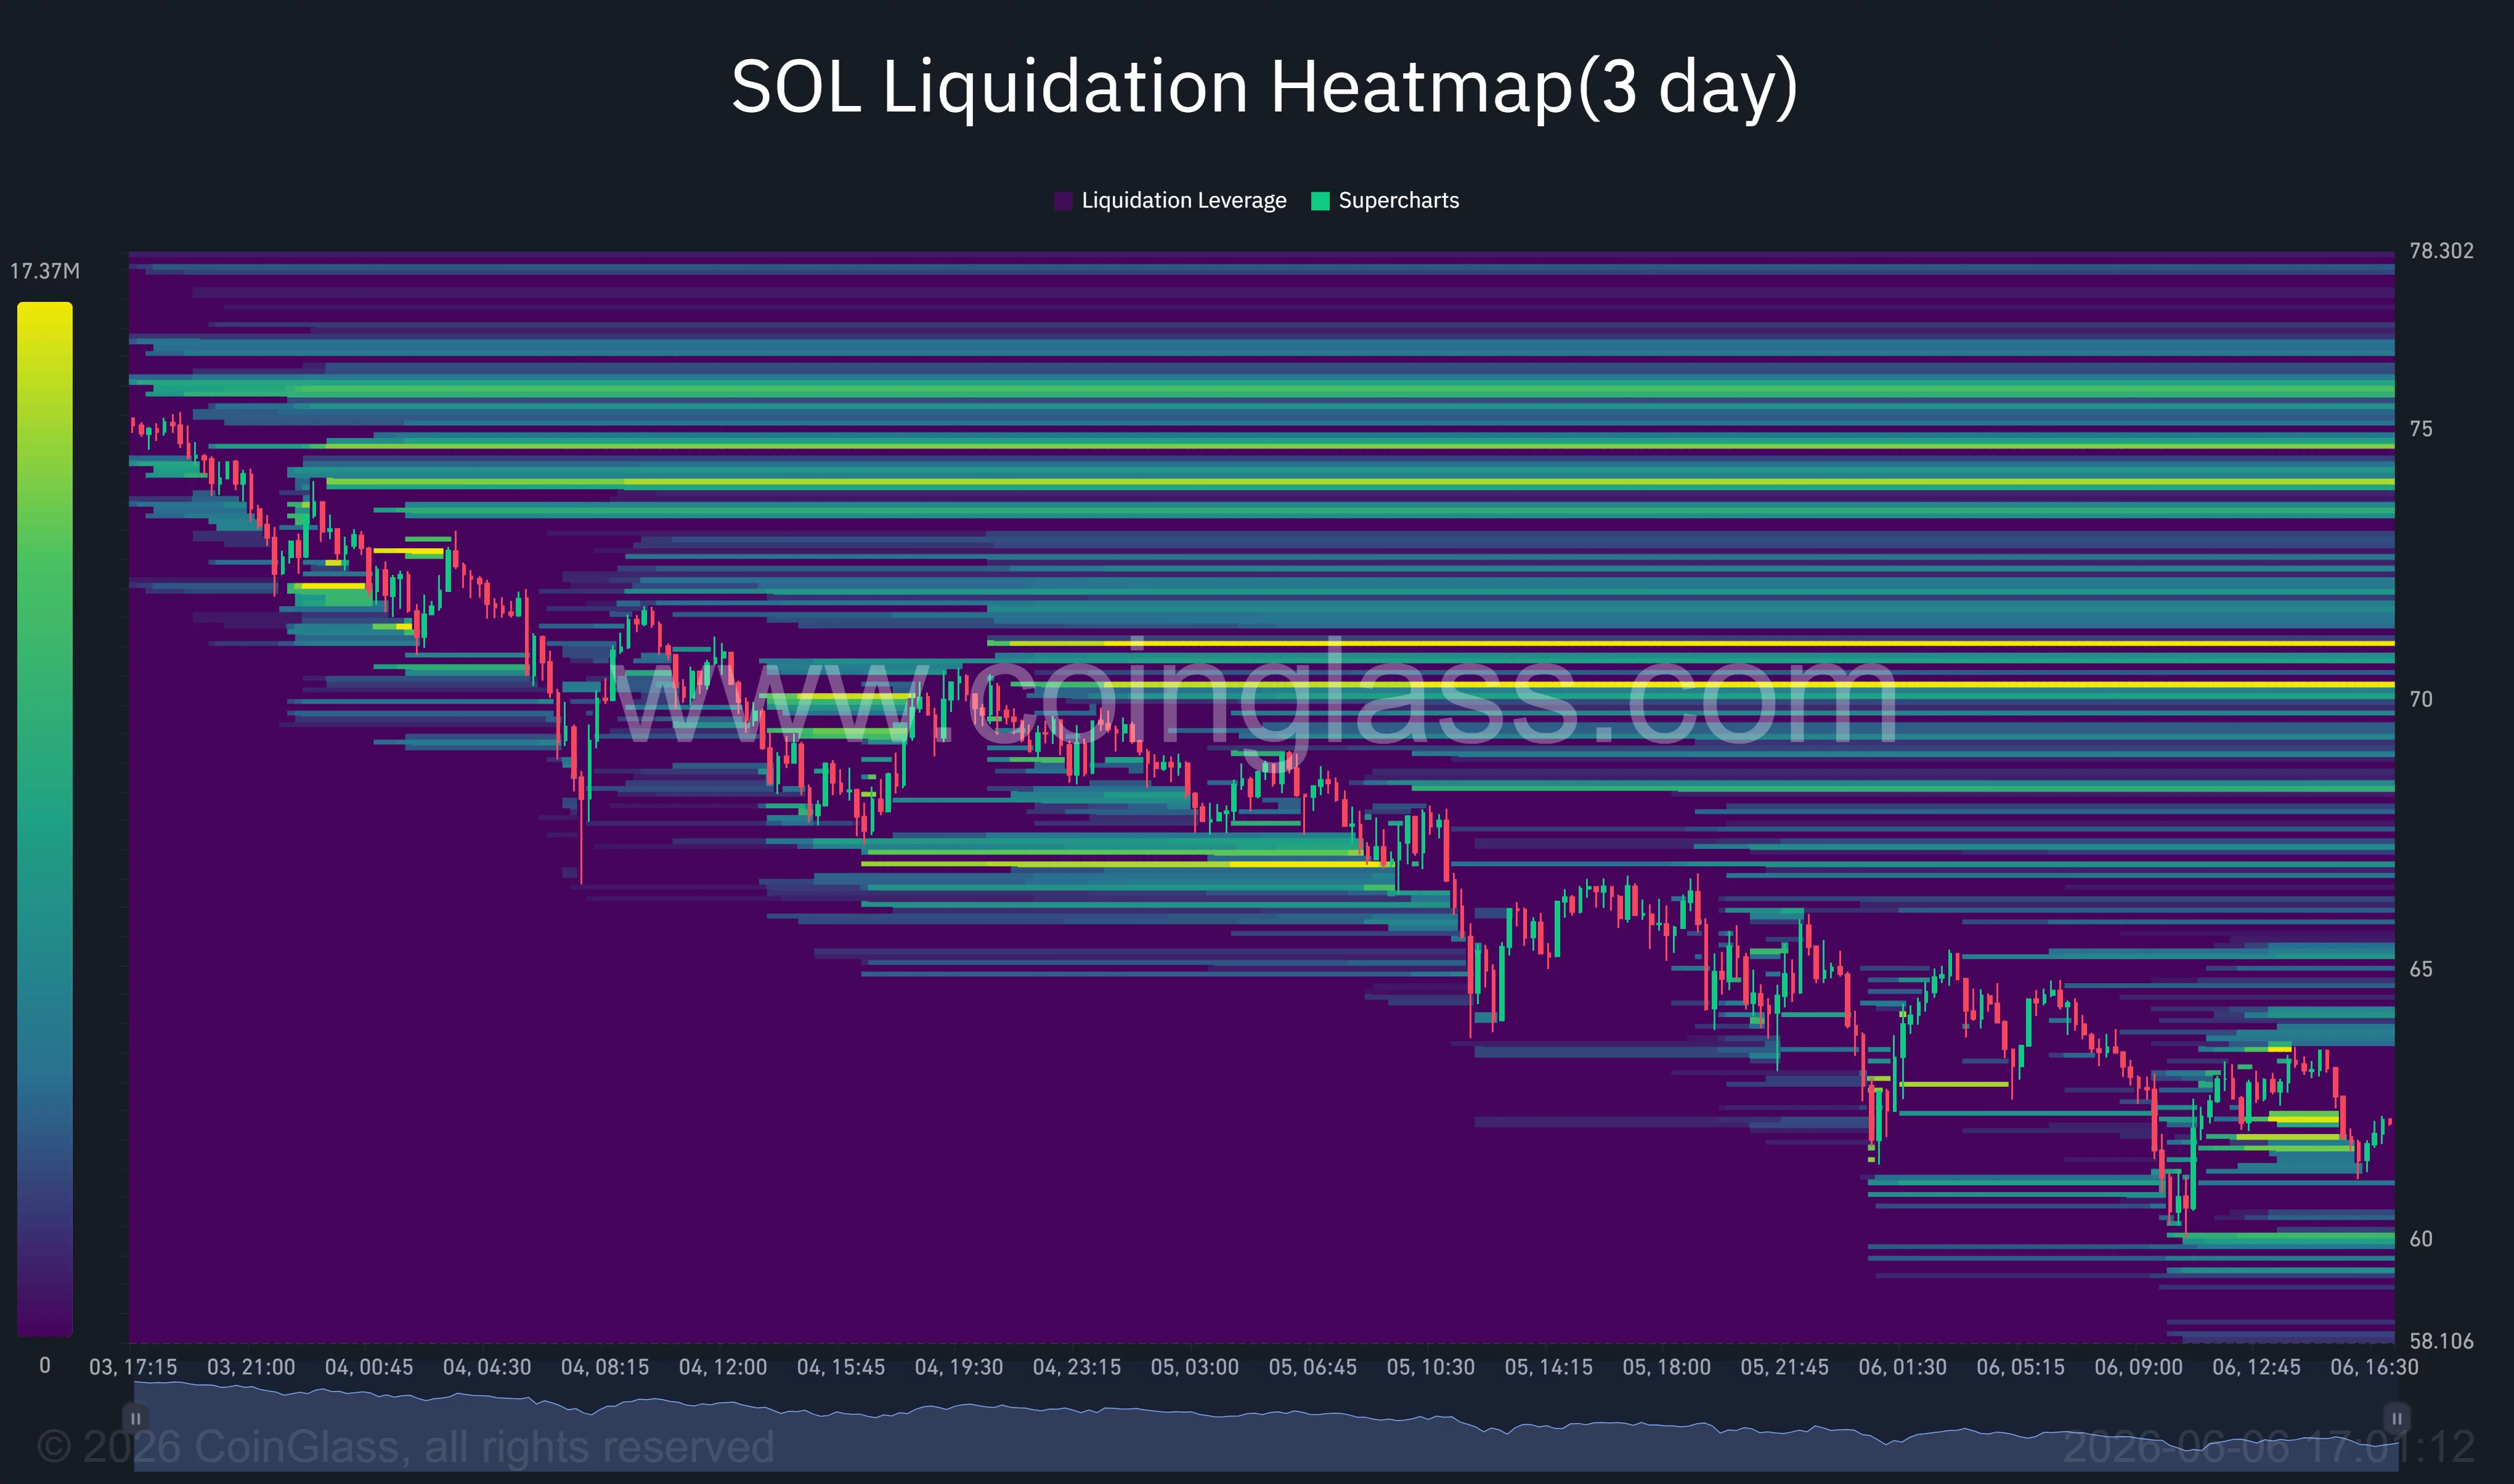
Below the market, liquidity becomes noticeably thinner. The heatmap shows relatively limited support beneath the recent lows compared with the large concentration of positions overhead, increasing the risk of an accelerated move if sellers force another breakdown.
A decisive breakdown below the $51.5 support zone could expose Solana to the psychological $50 level. Since the chart shows limited historical trading activity beneath that area, sellers could attempt to force a deeper move if market conditions remain unfavorable.
Any bullish recovery would likely require SOL to reclaim the former support area near $70 before challenging the heavy liquidation cluster between $74 and $75.
For now, corporate treasury transfers, ETF outflows, aggressive derivatives liquidations, and unfavorable macro conditions continue to keep pressure on the market, leaving the $50 level firmly on traders’ radar.
Disclosure: This article does not represent investment advice. The content and materials featured on this page are for educational purposes only.