Solana price has surged more than 20% from its June low and returned to a critical support-turned-resistance level that could determine whether the token reclaims its multi-month consolidation range.
Summary
- Solana price has rebounded more than 20% from its June low and is testing the former support level of a multi-month consolidation range near $75.7.
- A breakout above the range floor could reopen a path toward $83.5, $90, and eventually the channel resistance near $98.3.
- Failure to reclaim $75 could trigger a pullback toward $71.8, $69.1, and potentially the June low around $60.
According to data from crypto.news, Solana (SOL) price traded around $75 on June 16, up more than 20% from its early June low near $60.
SOL’s recovery followed reports that the U.S. and Iran had reached a framework agreement that could reopen the Strait of Hormuz, easing concerns about energy supply disruptions and inflation. Oil prices moved lower after the announcement, while Bitcoin, Ethereum, and other risk assets posted strong gains.
The rally has also coincided with renewed institutional activity surrounding the Solana ecosystem. On June 15, Solana Company rejected a non-binding acquisition proposal from Forward Industries. The proposal valued the company at a premium to its market price and arrived amid growing competition among firms building SOL-focused treasury strategies.
Derivatives markets have reinforced the move. CoinGlass data showed open interest climbing alongside price during the rebound, while the sharp recovery forced traders holding bearish positions to unwind. Liquidation-driven buying helped accelerate the move from the low-$60 region toward current levels.
Solana is attempting to reclaim a lost multi-month support zone
The daily chart shows that Solana spent nearly four months trading inside a horizontal consolidation channel bounded by support near $75.7 and resistance around $98.3. The structure broke down in early June when sellers pushed SOL below the range floor, triggering a decline toward $60.
Solana has now returned to the former support zone, placing the market at a critical technical inflection point. A successful reclaim would invalidate the recent breakdown and place Solana back inside the channel that governed price action throughout much of 2026.
On the four-hour chart, SOL has already broken above a descending trendline that had capped rallies since late May. The recovery also carried price through several Fibonacci retracement levels measured from the June decline.
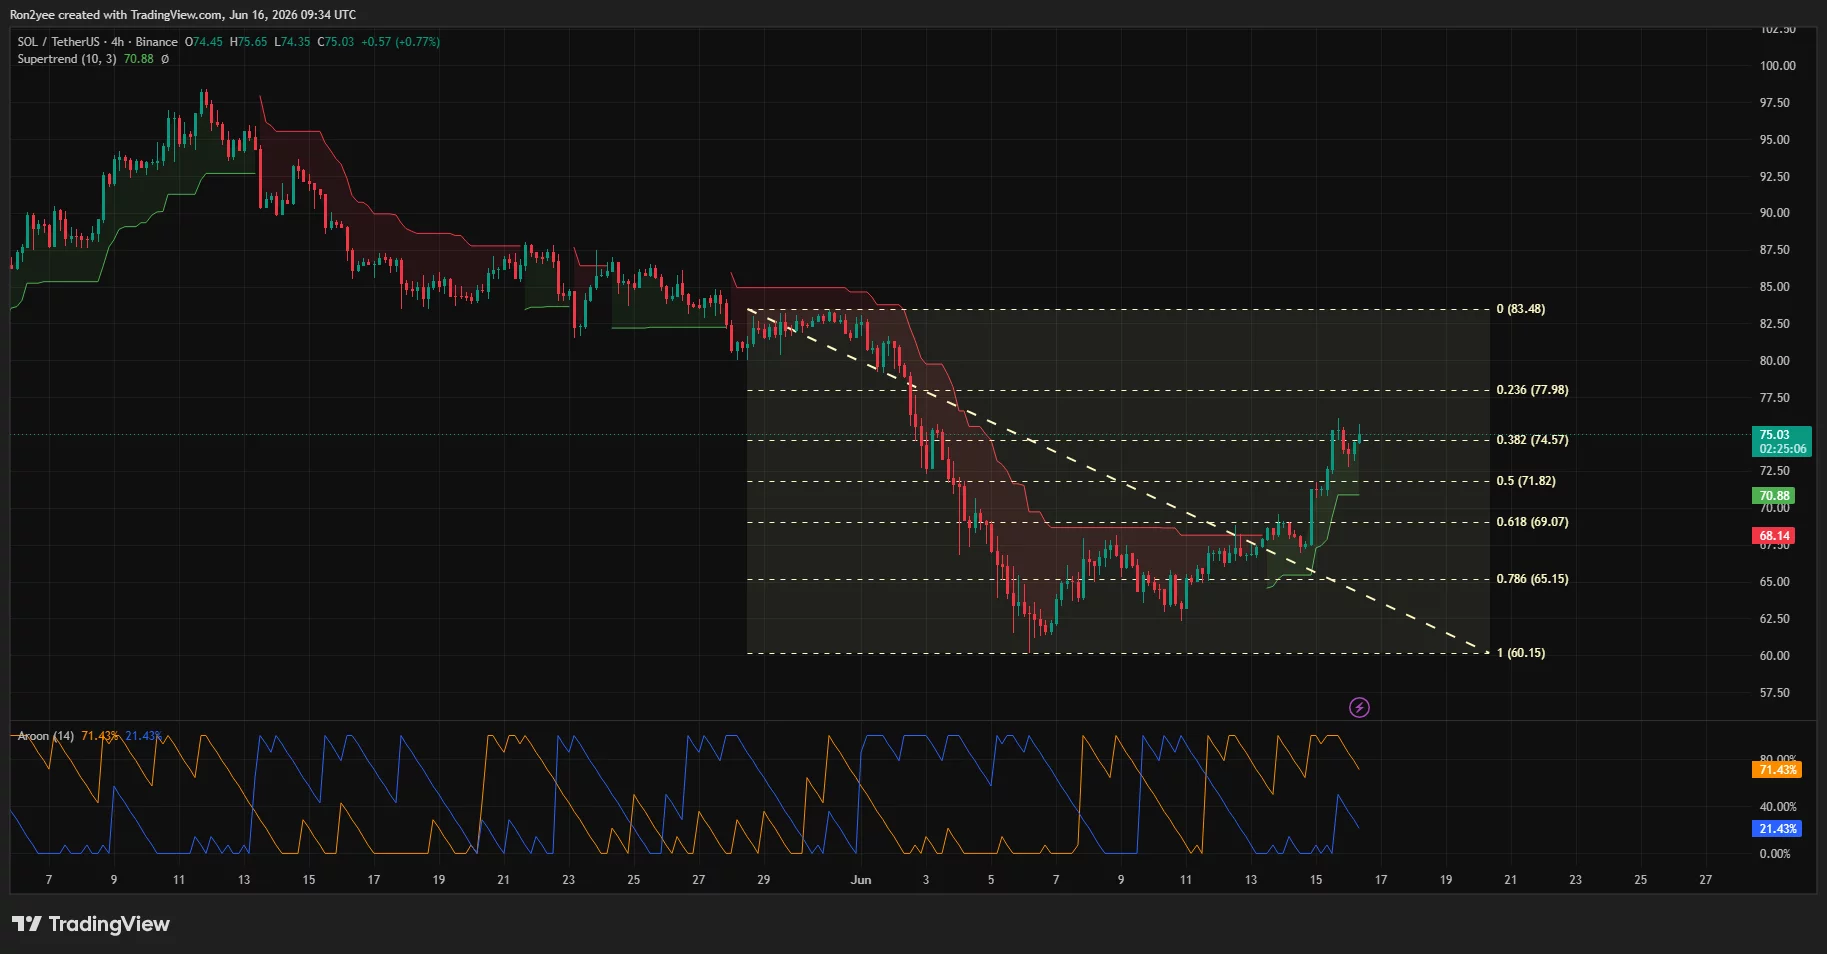
Immediate resistance sits near the 0.382 Fibonacci level at $74.6, followed by $78 and then the prior swing high around $83.5. Beyond that area, traders would likely focus on the upper half of the former consolidation range between $90 and $98.
Momentum indicators have improved alongside the price recovery. The daily RSI has moved back above 50 after briefly entering oversold territory earlier this month, while the MACD has started to turn higher after a prolonged bearish phase. On the four-hour timeframe, the Supertrend indicator remains bullish with support near $70.9.
Not all analysts are convinced the recovery is complete. In a June 16 X post, analyst Crypto Coral said Solana recently broke down from a bearish flag structure and remains near a key resistance zone.
“$SOL broke down from a bearish flag and is now retesting key resistance near the EMA. Unless bulls reclaim this level, $SOL could face another leg lower before a sustainable reversal.”
Failure at $75 could expose downside toward the June lows
A rejection near the former range floor would strengthen the case that the recent rally is merely a retest of broken support rather than the beginning of a larger trend reversal.
Under that scenario, traders would likely monitor the 50% Fibonacci retracement near $71.8 and the 61.8% level around $69.1 as the first downside targets. A break below those levels could expose support near $65 before attention shifts back to the June low around $60.
Macro risks remain present despite the latest relief rally. The market’s recent gains have been tied closely to developments surrounding the U.S.-Iran agreement and expectations that the Strait of Hormuz will remain open. Any setback in negotiations, renewed tensions in the region, or a rebound in oil prices could pressure risk assets and weaken demand for cryptocurrencies.
As such, Solana’s battle around $75 remains the key chart level. Bulls need a decisive reclaim of the former channel floor to reopen a path toward $90 and eventually $98, while sellers will look for rejection at resistance to reassert control of the trend.
Disclosure: This article does not represent investment advice. The content and materials featured on this page are for educational purposes only.