
pcess609
DEAR BARON GROWTH FUND SHAREHOLDER:
PERFORMANCE
Baron Growth Fund® (the Fund) rose 7.88% (Institutional Shares) during the quarter ended March 31, 2023. This exceeded the Fund’s primary benchmark, the Russell 2000 Growth Index (the Benchmark), which rose 6.07%. It also outperformed the S&P 500 Index, which measures the performance of publicly traded large-cap U.S. companies, which gained 7.50% during the period.
The sudden failures of Silicon Valley Bank (SVB), Signature Bank, and Silvergate Bank raised concerns about the health of the U.S. regional banking system. The Fund does not own any commercial banks and has not held an investment in a bank for the past 11 years. We also do not make investments that are contingent on forecasting interest rates, commodity prices, or other macroeconomic variables. We exclusively invest in businesses with durable competitive advantages, that sell highly differentiated products or services, have sticky customer bases and recurring revenue, and are run by management teams that are focused on long-term growth and value creation.
Table I.
Performance
Annualized for periods ended March 31, 2023
|
Baron Growth Fund Retail Shares[1],[2] |
Baron Growth Fund Institutional Shares1,2,[3] |
Russell 2000 Growth Index1 |
S&P 500 Index1 |
|
|
Three Months4 |
7.82% |
7.88% |
6.07% |
7.50% |
|
One Year |
(3.64)% |
(3.40)% |
(10.60)% |
(7.73)% |
|
Three Years |
19.57% |
19.87% |
13.36% |
18.60% |
|
Five Years |
12.01% |
12.30% |
4.26% |
11.19% |
|
Ten Years |
11.48% |
11.77% |
8.49% |
12.24% |
|
Fifteen Years |
10.51% |
10.77% |
8.67% |
10.06% |
|
Since Inception (December 31, 1994) 12.84% |
12.99% |
7.46% |
10.13% |
|
The most significant financial crisis since 2008 emerged with the sudden failures of three U.S. regional banks. The crisis ricocheted through select U.S. regional banks and ensnared large European banks including Credit Suisse.
Performance listed in the above table is net of annual operating expenses. Annual expense ratio for the Retail shares and Institutional shares as of September 30, 2022 was 1.30% and 1.04%, respectively. The performance data quoted represents past performance. Past performance is no guarantee of future results. The investment return and principal value of an investment will fluctuate; an investor’s shares, when redeemed, may be worth more or less than their original cost. The Fund’s transfer agency expenses may be reduced by expense offsets from an unaffiliated transfer agent, without which performance would have been lower. Current performance may be lower or higher than the performance data quoted. For performance information current to the most recent month end, visit www.BaronFunds.com or call 1-800-99BARON.
[1] The Russell 2000® Growth Index measures the performance of small-sized U.S. companies that are classified as growth and the S&P 500 Index of 500 widely held large cap U.S. companies. All rights in the FTSE Russell Index (the “Index”) vest in the relevant LSE Group company which owns the Index. Russell® is a trademark of the relevant LSE Group company and is used by any other LSE Group company under license. Neither LSE Group nor its licensors accept any liability for any errors or omissions in the indexes or data and no party may rely on any indexes or data contained in this communication. The indexes and the Fund include reinvestment of dividends, net of withholding taxes, which positively impact the performance results. The indexes are unmanaged. Index performance is not Fund performance; one cannot invest directly into an index.
[2] The performance data in the table does not reflect the deduction of taxes that a shareholder would pay on Fund distributions or redemption of Fund shares.
[3] Performance for the Institutional Shares prior to May 29, 2009 is based on the performance of the Retail Shares, which have a distribution fee. The Institutional Shares do not have a distribution fee. If the annual returns for the Institutional Shares prior to May 29, 2009 did not reflect this fee, the returns would be higher.
[4] Not annualized.
Regulators and government agencies, assisted by large commercial banks, moved aggressively to assuage depositors’ fears and head off additional failures across the U.S. regional banking system. Equity markets overcame these concerns to finish higher for the quarter. The S&P 500 Index rose 7.50%, while the MSCI ACWI ex USA Index, which measures stock performance across 46 different global markets, rose 6.87%. Baron Growth Fund gained 7.88%, which exceeded our Benchmark’s performance by 1.81% due to favorable stock selection.
We believe that the sharp increase in interest rates over the last 12 months catalyzed the crisis by exposing the significant mismatch between banks’ assets and liabilities. An extended period of historically low interest rates allowed banks to attract deposits from individuals and businesses while offering negligible yields. Banks then reinvested those deposits in longer duration assets, such as mortgages, corporate debt, and U.S. Treasury securities, with terms that could reach up to 30 years. As interest rates have risen, depositors began to move funds out of low-yielding deposit accounts and into higher-yielding products such as money market funds. At the same time, higher interest rates reduced the market value of the longer-duration assets held on banks’ balance sheets, since the prices of such securities are inversely related to interest rates. Banks that needed to raise cash to meet withdrawal requests were forced to sell assets at these discounted market values. Fear of this duration mismatch rapidly turned to panic, as depositors worried that they could lose the uninsured portion of their deposits, causing runs on certain banks and forcing regulators to take decisive action.
The Fund does not own any regional banks and has not made or held an investment in a regional bank for the past 11 years. We have deliberately decided not to invest in banks due to the inherent opacity of bank balance sheets, their sensitivity to changes in interest rates, and the minimal competitive differentiation between most banks. Instead, we focus on investing in businesses that are transparent, have durable competitive advantages, offer differentiated products and services, and are managed for the long term. This discipline has served us well since inception, and we expect to maintain this approach going forward. As such, while regional bank stocks are presently inexpensive versus their historical valuations, we will not compromise on business quality and competitive advantages to purchase a stock just because it is inexpensive. Instead, we have taken advantage of the banking-induced uncertainty to initiate new positions in businesses that we believe are extremely high quality and attractively valued relative to their long-term growth prospects. Please see the section entitled “Recent Purchases” for an overview of our new positions.
We think the current environment reinforces the merits of our investment philosophy and our unwavering focus on durable competitive advantages and long-term managerial orientation. It took decades for many of these banks to build their businesses and reputations – SVB was founded in 1983, Silvergate Bank was founded in 1988, and Credit Suisse can trace its history to 1856. However, it took just hours or days for them to unwind, undone by a combination of short-term decision-making, questionable risk management practices, and products that are largely commoditized. We exclusively seek to invest in businesses with sustainable competitive advantages, that sell highly differentiated products or services, have sticky customer bases, and are run by management teams that optimize for longterm growth. We spend the majority of our time working with our growing team of analysts to iteratively research these businesses. We seek to invest in those businesses at attractive prices, and endeavor to hold our investments for the long term.
While we don’t own banks or other interest rate sensitive securities, we have invested 39% of Fund assets in securities that we consider to be Financials. Within this cohort, 52% of our investments are technology-enabled market data vendors such as FactSet Research Systems Inc., MSCI Inc., and Morningstar, Inc. These are businesses that serve vast and growing end markets, which we estimate represent at least $40 billion of annual recurring revenue. They start with a proprietary set of data assets that have been collected over decades. This carries significant fixed costs and time to collect, and in many ways would be impossible to replicate now. Once those assets have been collected, the vendors use them to build mission critical products and services that become deeply embedded in customer workflows. This creates recurring revenue, high retention rates, and annual pricing power. And since the products are delivered electronically and all data has already been collected, the incremental margins are extremely high.
The remaining 48% of our Financials exposure includes differentiated insurers or unique advisory businesses. We believe that they have carved out unique and sustainable competitive advantages, such as Primerica, Inc.’s extensive distribution network or Arch Capital Group Ltd.’s best-in-class underwriting discipline. We also believe that all are benefiting from compelling secular trends, such as Kinsale Capital Group, Inc.’s exposure to dramatic growth in the Excess & Surplus insurance market.
While we consider these investments Financials, their success is not dependent on interest rates and they do not assume any credit risk. All share the attractive characteristics that we value in our investments, which include large addressable markets, positive secular trends, sustainable competitive advantages, attractive business models underpinned by recurring revenue, annual price increases, robust free-cash-flow generation, and best-in-class management teams.
One of our largest and longest held financials positions is FactSet. We estimate that the company serves an addressable market that exceeds $32 billion of annual recurring revenue. This is almost 16 times larger than its current size, offering a long runway for sustained growth. We believe that FactSet has built a highly differentiated portfolio of products, underpinned by unique data and analytics, expertise in data cleansing and concordance, a unique open-architecture approach, and best-in-class customer service. FactSet customers use the product as their primary workflow or analytics tool, creating sticky and visible revenue streams that have enjoyed retention rates above 95% for decades. FactSet is highly profitable, with EBIT margins of approximately 35%, and robust free-cash-flow generation.
FactSet’s management team exclusively focuses on driving sustainable longterm growth. For example, three years ago the company announced a $100 million investment program to be incurred over three years. FactSet’s investments were designed to collect proprietary data about private markets, to collect “deep sector” information, and to enhance the breadth and depth of its digital platform. While the investment reduced earnings in the short term, the investment has generated attractive returns for shareholders. Today, FactSet’s rate of organic growth is approximately double its pre-investment level, its margins have mostly recovered, and its competitive positioning has been structurally enhanced.
We initially invested in FactSet in 2006. Over that period, FactSet has grown its revenue by 4.8 times and its EPS by 6.3 times, which corresponds to a 10% CAGR in revenue and a 12% CAGR in earnings. This consistent and recurring growth has generated a 14.9% CAGR in the stock since our initial purchase, exceeding the benchmark by 7.1% annually. We expect the company to generate similarly consistent financial results going forward and are optimistic that shares will respond similarly.
Table II groups our portfolio based on our assessment of the attributes that best characterize each investment. While this does not perfectly correlate to the Global Industry Classification Standard, the industry standard nomenclature, we believe it provides added transparency into our thought process.
Table II
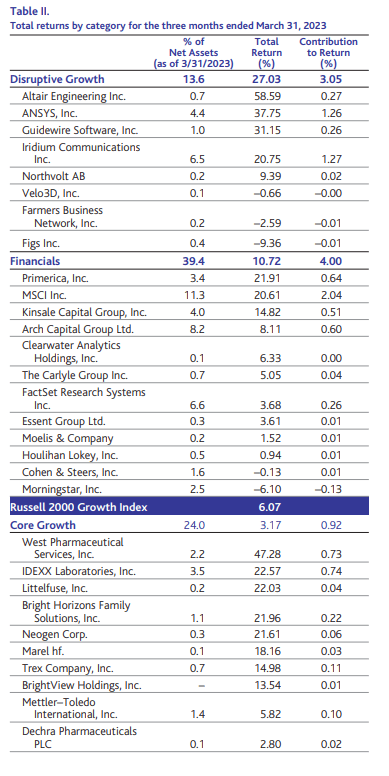
Table II. (continued)
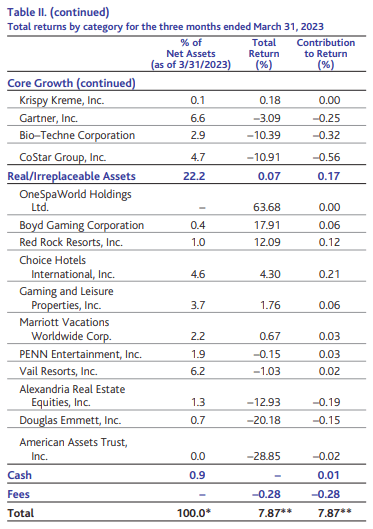
Sources: FactSet PA, BAMCO, and FTSE Russell.
* Individual weights may not sum to displayed total due to rounding.
**Represents the blended return of all share classes of the Fund.
Our investments in Financials, Core Growth, and Real/Irreplaceable Assets represent between 22.2% and 39.4% of the Fund’s net assets, and aggregate to 85.6% of net assets. The remaining 13.6% of net assets, excluding cash, are invested in businesses that we consider to be Disruptive Growth businesses, which we believe offer greater growth potential, albeit with more risk relative to other investments. We believe this balance appropriately reflects our goal to generate superior returns over time with less risk than our Benchmark. As shown in the table above, this strategy was effective during the quarter. Our Disruptive Growth and Financials investments gained 27.0% and 10.7%, respectively. Our Core Growth and Real/Irreplaceable Assets appreciated at a lower rate. In aggregate, this balanced approach led to strong performance on an absolute and relative basis.
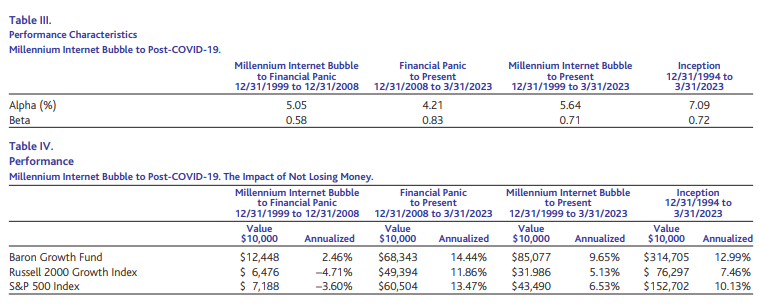
Table III and IV
Performance data quoted represents past performance. Past performance is no guarantee of future results. The indexes are unmanaged. Index performance is not Fund performance; one cannot invest directly into an index.
In addition to strong short- and medium-term results, the Fund has meaningfully outperformed its Benchmark over the long term. The Fund has gained 12.99% on an annualized basis since its inception on December 31, 1994, which exceeds that of the Benchmark by 5.53% and the S&P 500 Index by 2.86%, annualized. This represents robust absolute and relative returns across a variety of market environments, driven primarily by favorable stock selection. We attribute this result to not losing money during periods of significant market drawdowns, such as the nine years ended December 2008, as well as robust absolute and relative performance during the most recent five-year period.
While the Fund did not make much money from December 31, 1999, through December 31, 2008, a period which includes the highs of the Internet Bubble and the lows of the Financial Panic, it did generate a positive annualized return of 2.46%. Conversely, a hypothetical investment in a fund designed to track the Fund’s Benchmark would have declined in value by 4.71% on an annualized basis over the same time. Similarly, a hypothetical investment in a fund designed to track the large-cap S&P 500 Index would have declined 3.60% annualized. (Please see Table IV–Millennium Internet Bubble to Financial Panic). From the Financial Panic to present, the Fund generated an annualized return of 14.44%, which has exceeded that of its Benchmark by 2.58% annually, and the S&P 500 Index by 0.97% annually.
We believe that the power of compounding is better demonstrated by viewing these returns in dollar terms. A hypothetical investment of $10,000 in the Fund at its inception on December 31,1994 would be worth $314,705 on March 31, 2023. This is approximately 4.1 times greater than the $76,297 the same hypothetical investment made in a fund designed to track the Benchmark would be worth, and more than double a hypothetical investment in the S&P 500 Index. Hypothetically, our returns were achieved with approximately 28% less volatility than the Benchmark, as represented by its beta. (Please see Tables III and IV.) Importantly, we believe that the returns in the portfolio have come primarily through the compounded growth in the revenue and cash flow of the businesses in which we have invested rather than increases in valuation multiples. We are pleased that our long-term investments in what we believe are competitively advantaged companies with attractive growth prospects and exceptional management teams have generated attractive returns in good markets and have helped to protect capital during more challenging ones.
Table V.
Top contributors to performance for the quarter ended March 31, 2023
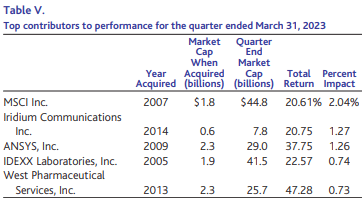
Shares of MSCI Inc., a leading provider of investment decision support tools, contributed to performance. The company reported resilient fourth quarter 2022 earnings results and gave a cautiously optimistic outlook for 2023. MSCI also benefited from improved performance in the global equity markets in the quarter, which most directly impacts MSCI’s asset-based fee revenue. We retain long-term conviction, as MSCI owns strong, “all weather” franchises and remains well positioned to benefit from numerous secular tailwinds in the investment community.
Iridium Communications Inc. is a leading mobile voice and data communications services vendor offering global coverage via satellite. Shares increased following the company’s announcement of a strategic partnership with Qualcomm aimed to integrate Iridium’s satellite communication technology into Qualcomm’s Snapdragon chip series. This partnership should provide a large growth opportunity for Iridium by significantly simplifying the integration of its technology with a slew of new devices including smartphones, laptops, tablets, and other connected devices within the Internet-of-Things (IoT) ecosystem. The relationship should generate revenue for Iridium not only through subscription services to potentially millions of devices but also through royalty and development payments. In addition, Iridium continued to see healthy growth across all key segments and has accelerated its robust shareholder return program with the announcement of its first cash dividend.
Shares of ANSYS, Inc., a leading provider of physics-based simulation software, contributed following another robust quarterly report. ANSYS benefits from strong secular trends, a broad product line, solid execution, and its strategic relationship with its customers. Together, these attributes have helped the company to generate resilient growth across revenue and cash generation that, despite foreign exchange and Russia-related headwinds, came in well above analyst expectations. In spite of general macroeconomic weakness, management described continued traction among large customers and a healthy demand environment, especially in key verticals including technology, alternative energy, automotive, and aerospace. ANSYS continues to invest in its core technology while adding new capabilities to support future growth initiatives including artificial intelligence and cloud. The multi-year transition of its licensing model should allow for better growth predictability and further margin expansion in coming years.
Table VI
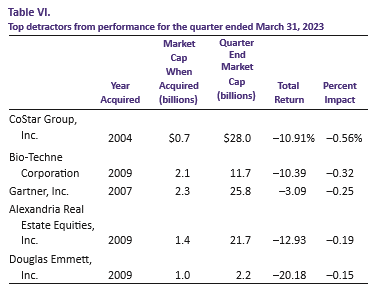
CoStar Group, Inc. is the leading provider of information and marketing services to the commercial real estate industry. The company is generating robust financial performance, with net new sales growing 15% in the quarter, and margins expanding by 200 basis points excluding growth investments. We expect the company’s core businesses to continue to benefit from the migration of real estate market spend to online channels. CoStar has begun to invest aggressively in building its residential marketing platform. We estimate CoStar invested around $230 million in this initiative in 2022, and its initial 2023 guidance implies a total investment approaching $500 million. While this is a significant upfront commitment, we believe the residential market represents a transformative opportunity. The company’s proprietary data, broker-oriented approach, and best-in-class management position it to succeed in this endeavor, in our view.
Bio-Techne Corporation is a leading developer and manufacturer of reagents, instruments, and services for the life sciences research, diagnostics, and bioprocessing markets. The stock detracted from performance following two consecutive quarterly earnings misses, combined with temporary headwinds including weakness in the company’s large order consumables business due to reduced biotechnology funding as well as COVID curbs in China. We believe the company is well positioned for long-term growth, with competitive advantages including a core research reagents business, a rapidly expanding cell and gene therapy manufacturing tools business, and an emerging cancer diagnostics business.
After meaningfully outperforming last year, shares of Gartner, Inc., a provider of syndicated research, gave up some gains in the first quarter. Business conditions have softened modestly, as Gartner’s IT vendor customer base is being negatively impacted by layoffs and cost reductions across the sector. Despite this headwind, Gartner is still generating attractive double-digit growth in research contract value. We expect sustained revenue increases and renewed focus on cost control to drive margin expansion and enhanced free-cash-flow generation over time. The company’s balance sheet is in excellent shape and can support aggressive repurchases and bolt-on acquisitions, in our view.
Recent Purchases
During the quarter, we made an initial investment in Clearwater Analytics Holdings, Inc., a leading software-as-a-service solution for asset owners and managers. Clearwater’s platform provides automated investment data aggregation, reconciliation, accounting, compliance, risk, performance, and reporting tools for insurers, asset managers, and corporations. Each day, the company reports on more than $6.4 trillion in assets across its base of 1,260 clients. Clearwater is a business that we have been researching for over a year, and the Fund was able to take advantage of market dislocation to initiate an investment at a compelling price.
We estimate that Clearwater serves a total addressable market (TAM) of approximately $6 billion of annual recurring revenue, or more than 16 times larger than its current base of business. We believe that the opportunity to launch new products and serve new customer types will effectively double its TAM over time. Clearwater’s cloud-based multi-tenant platform enables customers to reduce cost, time, and risk relative to their competitors, who frequently use legacy software in combination with manual processes. Clearwater also benefits from network effects related to its single database model where securities are processed once and leveraged across all clients. As such, growth in Clearwater’s client base helps to broaden and deepen the company’s data set and reduces its cost of service. We believe the superiority of its offering is reflected in the company’s win rates, which are approximately 80% in competitive situations. We also believe this is reflected in Clearwater’s 98% gross retention rate and a net promoter score above 60.
We believe Clearwater is well positioned to achieve consistent 20% organic revenue growth driven by a combination of greater adoption from existing clients, new client acquisition, international expansion, and deeper penetration into adjacent client types. Clearwater is poised to launch several new products including Prism, LPx, and JUMP Technology, which should help increase net revenue retention over time. Finally, long-term asset appreciation should provide a modest tailwind to growth over the long term.
We believe that the company employs an attractive financial model. Clearwater sells recurring subscription agreements, which have been augmented by a recent pricing model transition to minimize asset-based revenue fluctuations. The company already generates EBITDA margins in the high-20% range, which we expect to expand to 40% over time with the benefits of scale. We believe that Clearwater will be a steady earnings compounder, which we anticipate driving solid returns for the stock over a multi-year period.
We also made an investment in Krispy Kreme, Inc., a manufacturer and retailer of branded fresh doughnuts. Krispy Kreme operates an omni-channel model, selling its product through its owned and franchised doughnut shops, in grocery and convenience stores through its Delivered Fresh Daily (DFD) network, and via e-commerce and delivery in the U.S. and non-U.S. markets. The company also owns Insomnia Cookies, a digital-first brand specializing in cookies and focused on young consumers.
Krispy Kreme benefits from strong global brand awareness and ubiquitous appeal. The company’s brand awareness is supported by experiential shops known as Hot Light Theaters, which create an immersive and interactive environment to showcase the brand and high-quality product. At the same time, Krispy Kreme’s unique hub-and-spoke model allows the company to maximize customer reach and minimize capital expenditures while maintaining freshness and quality.
Krispy Kreme is well positioned to realize long-term revenue and EBITDA growth by expanding and optimizing the hub-and-spoke model. In the U.S., where the hub-and-spoke model is less mature, the company can significantly increase points of access, drive revenue per hub, and improve EBITDA margins with limited capex. In addition, there are still large untapped markets in the U.S., including Boston and Minneapolis, where new hub-and-spoke networks can be established. Internationally, where the hub-and-spoke model is more developed, Krispy Kreme intends to drive growth by further expanding its DFD reach and by entering new markets.
We believe that Krispy Kreme is well positioned for durable growth. Customer feedback indicates that the most significant barrier to greater consumer adoption is proximity to the company’s products. This supports the company’s strategy to expand from fewer than 12,000 fresh points of access today to 18,500 over the next four years, with the potential for 75,000 in the long term. We believe that the company can enhance revenue growth with margin improvement through various cost cutting and efficiency initiatives, including the implementation of more automated manufacturing processes.
Portfolio Structure and Investment Strategy
We seek to invest in businesses with durable fundamental characteristics and attractive long-term growth prospects. These attributes include high barriers to entry, sustainable competitive advantages, large and growing addressable markets, and enduring secular tailwinds. We favor business models that have high levels of recurring and predictable revenue, generate attractive incremental margins, are cash generative, and are not dependent on third-party financing. We exclusively invest with management teams that consistently reinvest into their businesses. This is to raise barriers to entry and pursue long-term profitable growth. We work with our growing team of research analysts and portfolio managers, who are senior analysts, to verify, refine, or refute our assessment of these businesses and our expectations for durable growth across business cycles.
We hold investments for the long term. As of March 31, 2023, our weighted average holding period was 15.3 years. This is dramatically longer than most other small-cap growth funds, which, according to Morningstar, turn over about 76% of their portfolios annually based on an average for the last five years. The portfolio’s 10 largest positions have a weighted average holding period of 17.0 years, ranging from a 6.3-year investment in Kinsale Capital Group, Inc. to investments in Choice Hotels International, Inc. and Vail Resorts, Inc. that now both exceed 26 years. We have held 23 investments, representing 77.4% of the Fund’s net assets, for more than 10 years. We have held 20 investments, representing 21.7% of the Fund’s net assets, for less than 10 years. We believe that Table VII and Table VIII quantify the merits of our long-term holding philosophy.
Table VII
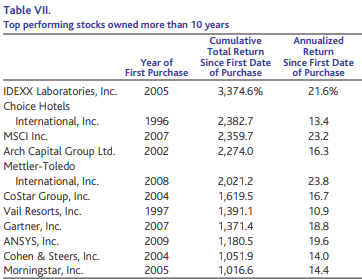
The cohort of investments that we have held for more than 10 years earned a weighted average annualized rate of return of 16.7% since we first purchased them. This exceeded the performance of the Fund’s Benchmark by 8.4% annualized. Four of these investments have achieved annualized returns that exceeded the Benchmark by more than 10% per year.
Table VIII
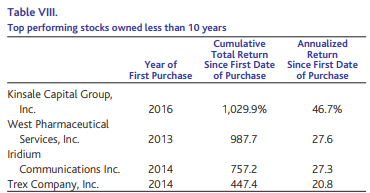
The cohort of investments that we have held for less than 10 years has returned 24.6% annually on a weighted average basis since our initial purchase, exceeding the Benchmark by 18.3% annualized. Eight of these investments have achieved annualized returns that exceeded the Benchmark by more than 10% per year, including five that have achieved annualized returns that exceeded the Benchmark by more than 15% per year.
Portfolio Holdings
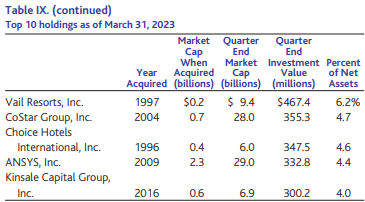
As of March 31, 2023, we owned 43 investments. The top 10 holdings represented 63.2% of the Fund’s net assets, many of which have been held for more than 10 years. All were small-cap businesses at the time of purchase and have become top 10 positions mostly through stock appreciation. Our holdings in these stocks have returned 20.2% annually based on weighted average assets since our initial investment, exceeding the Benchmark by an average of 12.6% annually. We attribute much of this relative outperformance to the superior growth rates and quality exhibited by these businesses relative to the Benchmark average. We believe all our positions offer significant further appreciation potential individually, and that the Fund’s diversification offers potentially better-than-market returns with less risk than the market as measured by beta. Note that diversification cannot guarantee a profit or protect against loss.
While we only purchase small-cap companies, we tend to hold stocks as long as our investment thesis remains intact, and we see a path to earning attractive compounded returns. This causes the Fund to own a significant percentage of assets in securities that have appreciated beyond their market capitalizations at the time of purchase. Baron Growth Fund’s median market cap is $6.3 billion, and its weighted average market cap is $19.1 billion. This compares to Morningstar’s U.S. market cap breakpoints for small- and mid-cap funds of $6.8 billion and $39.3 billion, respectively, as of March 31, 2023.
Table IX
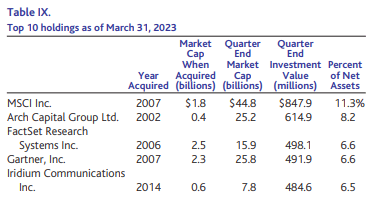
Table IX. (continued)
Thank you for joining us as fellow shareholders in Baron Growth Fund. We appreciate the confidence you have shown in us, and we will continue to work hard to justify that confidence.
Respectfully,
Ronald Baron, CEO and Lead Portfolio Manager
Neal Rosenberg, Co-Portfolio Manager
Editor’s Note: The summary bullets for this article were chosen by Seeking Alpha editors.