
Inok
By David Brady
If you’re wondering why gold and silver are heading south this on May 11 despite the Fed being on pause, lower than expected CPI and PPI, and another bank on the brink of bankruptcy (PacWest), I give you the Bullion Banks courtesy of Craig Hemke’s genius on the topic (no sarcasm intended).
Big Picture Fundamentals – Bullish
- Fed is done hiking, imho. They’re on a pause. “Fed officials leaning towards ‘summer vacation’ from hikes” following the lower-than-expected CPI, says WSJ’s Timiraos.
- ECB softens its stance on future rate hikes, boosting the DXY.
- Inflation continues to subside.
- Banking crisis delayed but not over. Banks tighten credit/loans. Depositors lose trust.
- Short squeeze in stocks, buybacks increase, earnings better than expected = melt-up.
- Central Banks continue to buy gold and silver at record levels. “Follow the smart money.”
- Inventories of physical gold and silver continue to deteriorate.
- Risk of war in Taiwan possible.
In summary, all of the major fundamentals favor higher gold and silver prices for the foreseeable future. The only major risk is a crash in stocks. The only fundamentals providing short-term reversals are debatable “data” such as Non-Farm Payrolls, GDP, inflation, and Bullion Banks taking the opportunity to push prices lower as the dollar bounces.
Gold
Sentiment – Bearish in the very short term. Remains bullish beyond that.
The level of bullishness in gold and silver recently matched or exceeded that at the previous peak on April 13. It was therefore no surprise that they both dropped on May 11.
Retail traders remain extremely bullish, but in a bull market, this is normal. Expect short-term reversals at extremes, but until we get a break of major support and/or a lower low, the trend remains up on all timeframes: daily, weekly, and monthly.
Technical Analysis, Elliott Waves, and Fibonacci Levels – Short-Term Bearish, Medium/Long-Term Bullish
Daily:
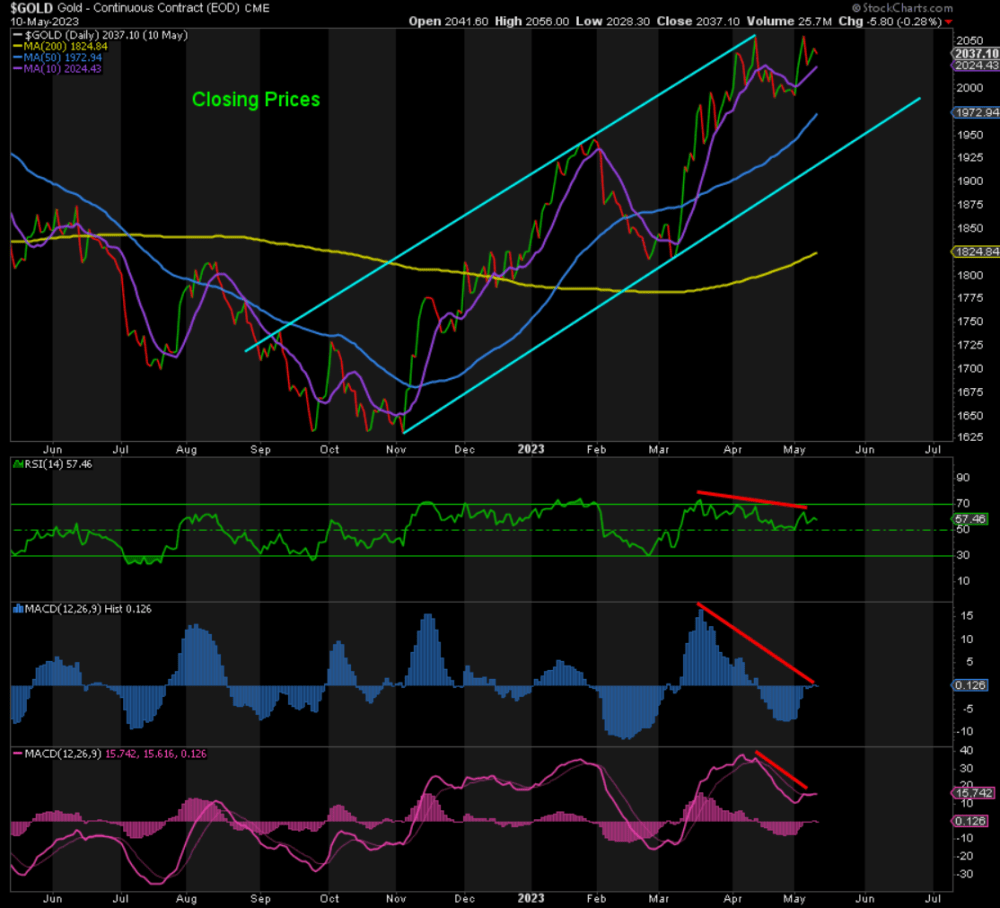
(Closing prices are used here because the momentum indicators are based on them, not intraday highs or lows)
Multiple negative divergences on all indicators at a double top in gold made it easy to anticipate the pullback that began on Friday. All it needed was a trigger. Enter the Non-Farm Payrolls, however unreliable the numbers are.
The DXY’s rebound provided the Bullion Banks the cover it needed to take gold down. Bullion Banks are staging an organized retreat and nothing more. Other than the banks, there are few if any impediments to a resumption of gold’s rally.
Gold is clearly in a channel right now. Channels are very powerful technical formations. They can continue for years. When broken, we typically see huge moves one way or the other, reinforcing their importance. Gold first peaked at 2055 in April when it hit the top of the channel. Now it’s heading south in the short term.
Support lies at 1990, the recent double bottom in gold. If this is broken, this opens up a move down to 1960, where the 50 DMA resides. Then 1950, where wave C = 1.618*wave A. Then comes the bottom of the channel between 1925-30 depending on the day. The 200 DMA is extremely unlikely to be tested unless the channel is broken to the downside.
On the subject of the 200 DMA, gold’s current price is way above it. This typically warrants a correction to close the gap between the two and supports further downside yet to come. So don’t be surprised by strong inflation numbers this coming week.
Lastly, this is just much-needed pullback to correct Gold’s overbought situation and provides the fuel necessary to take out the record high of 2089 on the next leg higher.
In summary, support is at 1990, 1950-60, and 1920-25. Resistance is at 2055 and, most importantly, 2089.
Weekly:
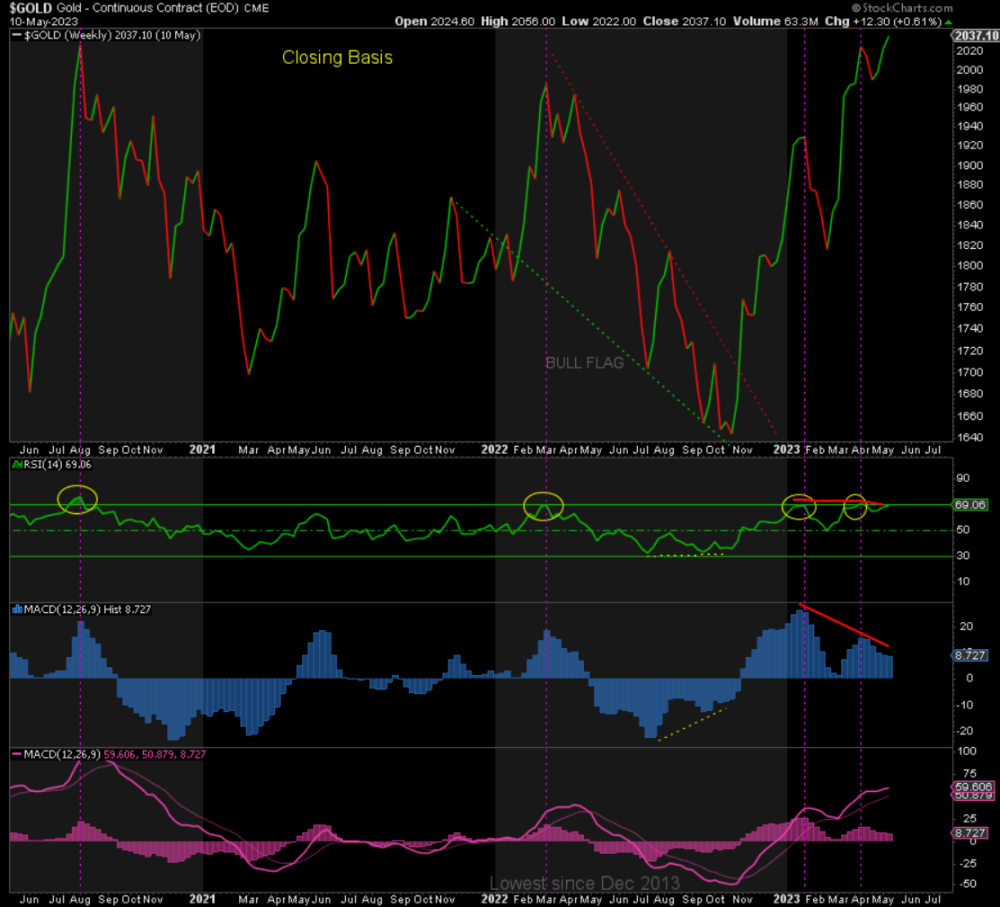
The weekly chart also shows a negatively divergent double top. The RSI is extreme overbought and negatively divergent for the second time. The MACD Histogram is also negatively divergent for the second time. Simply put, there are multiple negative divergences and it’s extreme overbought. It’s no surprise that we’re finally getting a pullback.
Based on the wave III rally from 1167 in Aug 2018 to 2089 in Aug 2020, and assuming we’re about to embark on a similar adventure north, we should not see the weekly RSI fall below 45.
Monthly:
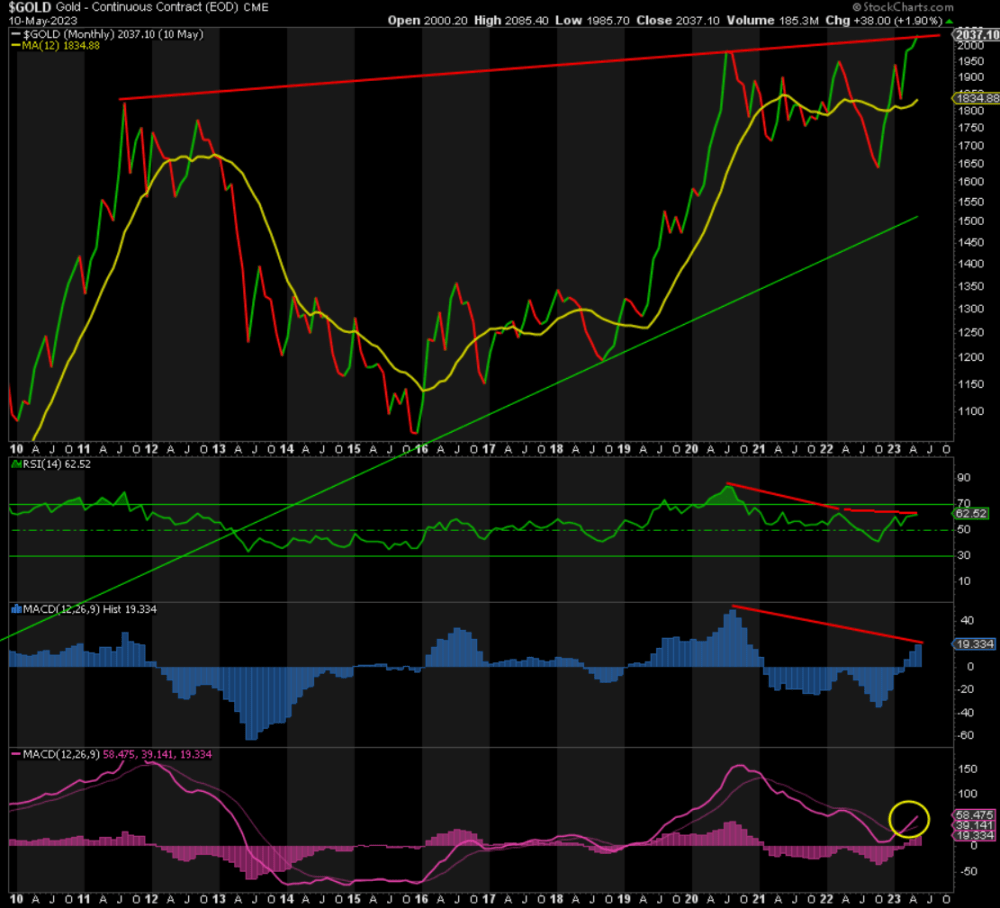
All that matters on the monthly chart is the MACD Line. It has clearly turned up and has a long way to go on the upside before even approaching the 2020 peak, never mind the 2011 peak. What this means is that whatever happens in the short term, gold has months of upside ahead, perhaps years.
In summary, a welcome pullback is underway, but once it is done, we’re not only going to new record highs next, we’re going much, much higher, imho.
COT Positioning – Bullish Medium/Long Term

Producers, the people that mine gold, have one of their lowest net short positions in history with gold at near-record highs. What does that tell you? They’re not hedging their future sales because they believe prices are going much, much higher. That is the only reason why they wouldn’t be hedging now. Extremely bullish beyond the short term.
Inter-Market Analysis – Bullish Medium/Long Term
DXY
Best guess, this is how I see DXY developing going forward:
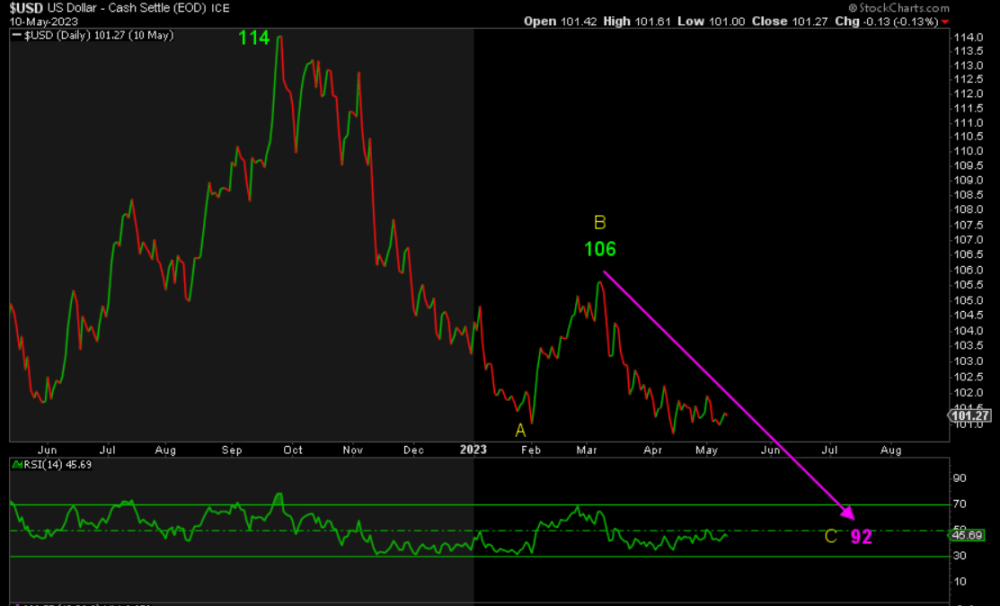
This is confirmed once DXY falls below 100. I expect to see 92 sometime in Q4. This can only be good for gold and the rest of the sector, regardless of any twists and turns along the way.
Silver
Technical Analysis, Elliott Waves, and Fibonacci Levels – Short-Term Bearish, Medium/Long-Term Bullish
Daily:
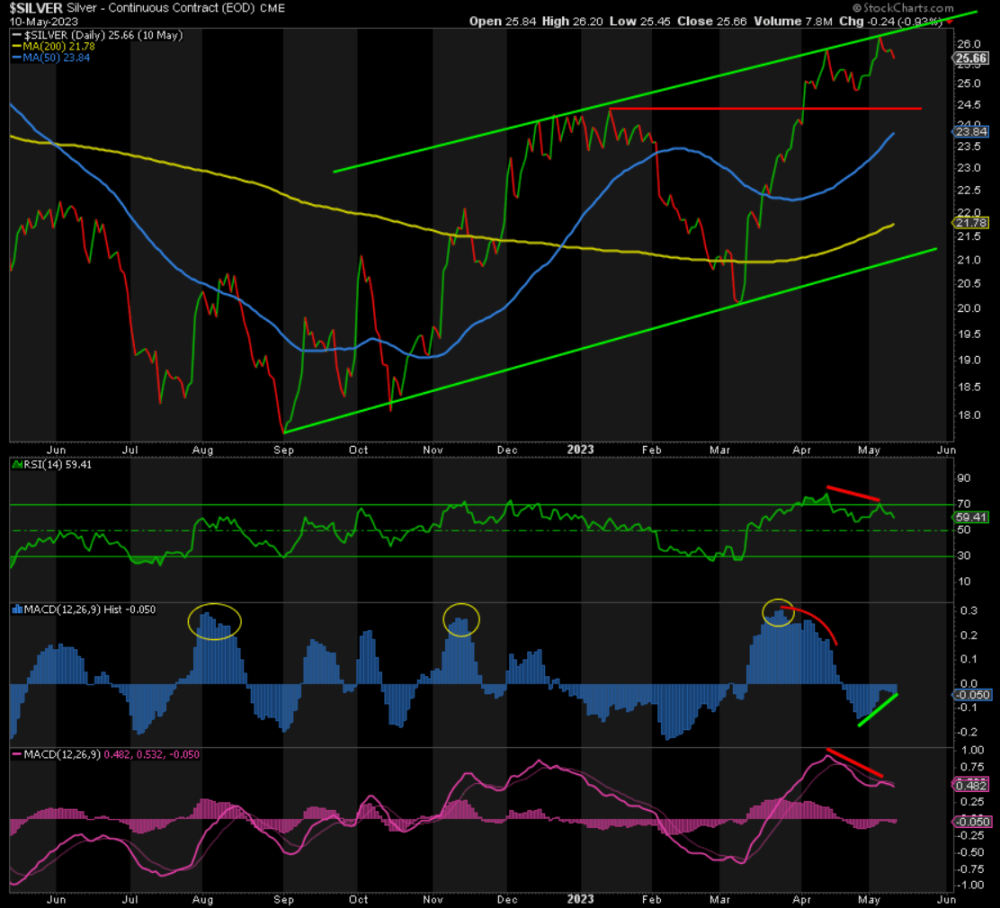
(Closing prices are used here because the momentum indicators are based on them, not intraday highs or lows)
Clear negative divergences on both the RSI and MACD Line at a higher high in price on Thursday. Coupled with extreme bullish sentiment, it explains the pullback that began on Friday. The MACD Histogram was turning up, but it didn’t break zero. Consequently, it fell back down with price.
Support lies at 24.30, previous resistance. Then it’s the 50 DMA, currently at 23.85, followed by the 200 DMA at 21.80. 24.30 also matches the technical support level based on an A-B-C correction.
On the subject of the 200 DMA, silver is way above, justifying at least a short-term correction.
As with gold, this is just a much-needed pullback to correct silver’s overbought situation and provides the fuel necessary to test $30 once the bottom is in place.
Weekly:
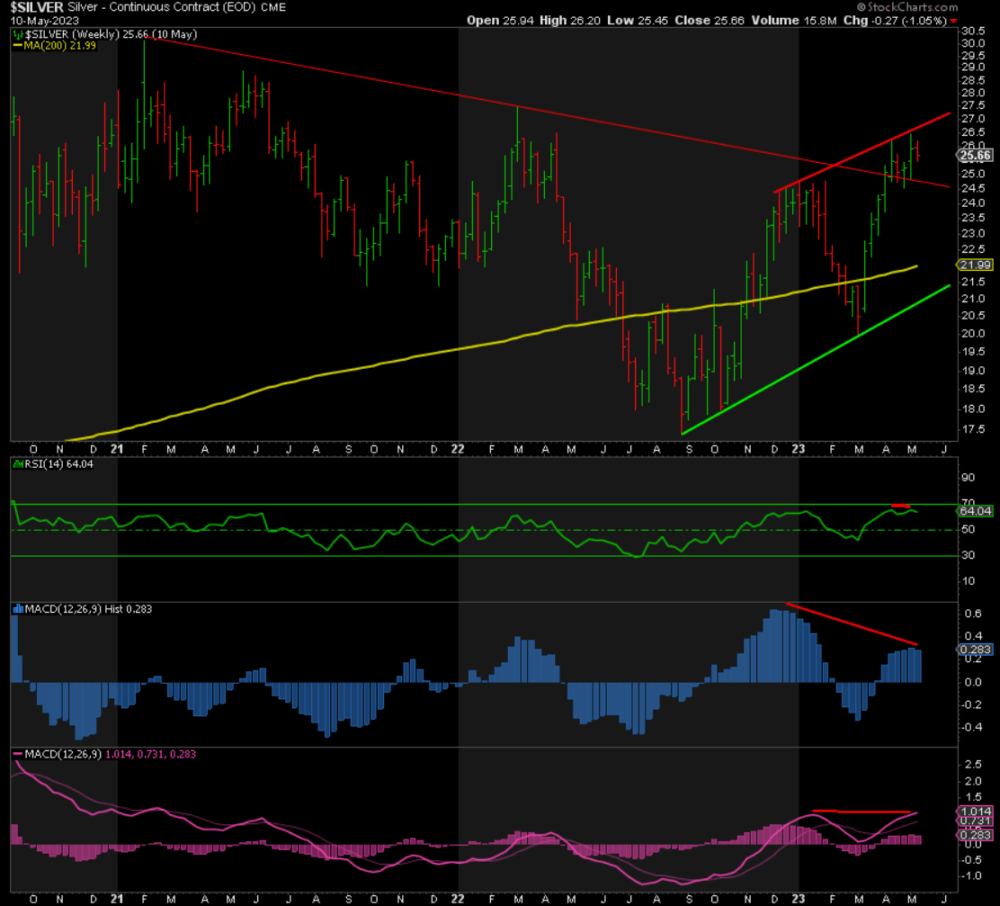
The weekly RSI is coming off its highest overbought level since Sept 2020 and negatively divergent on the RSI and both MACDs. This favors a continuation of this pullback.
Monthly:
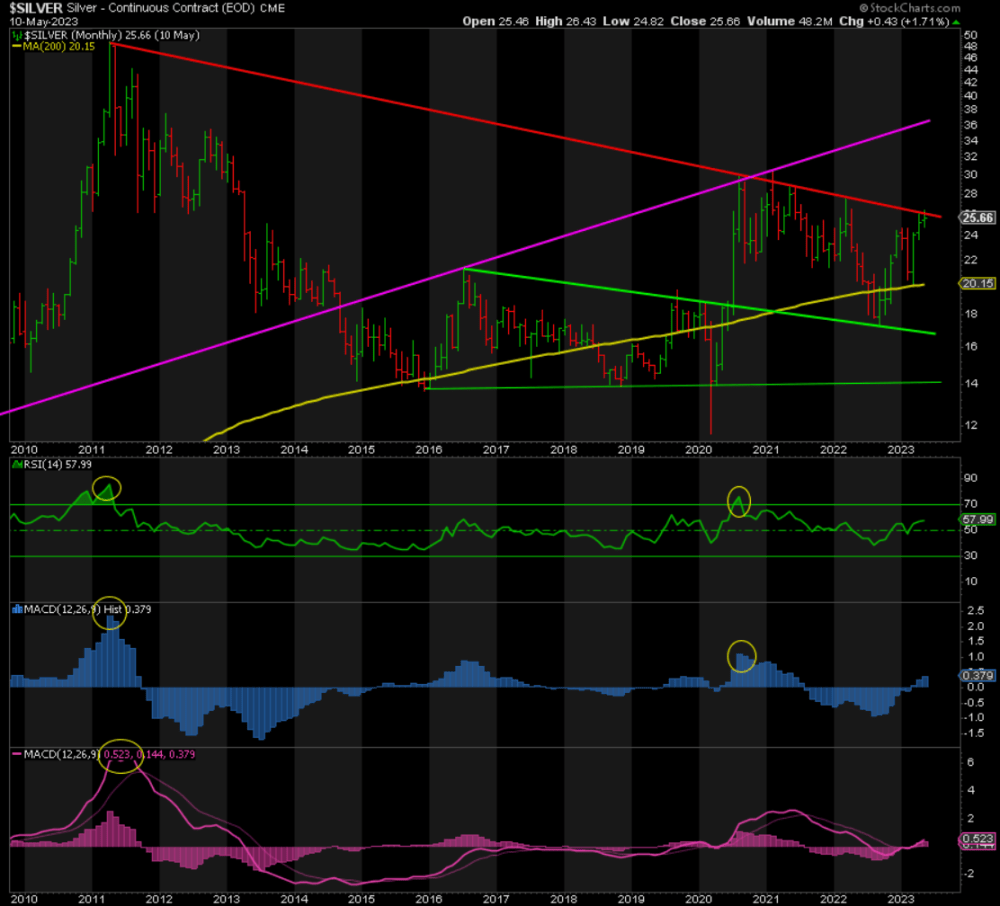
All of the indicators are trending up, most importantly the MACD line. They all have plenty of room to move higher over the coming months before becoming extreme overbought.
The MACD line shows massive potential given how far below it is from its 2011 peak. Whatever happens in the short term, silver is getting ready for $30 or higher, imho.
In summary, it looks like a short-term pullback has further downside, but once it is done, silver is going much, much higher.
Gold:Silver Ratio (“GSR”) – Bearish Short Term
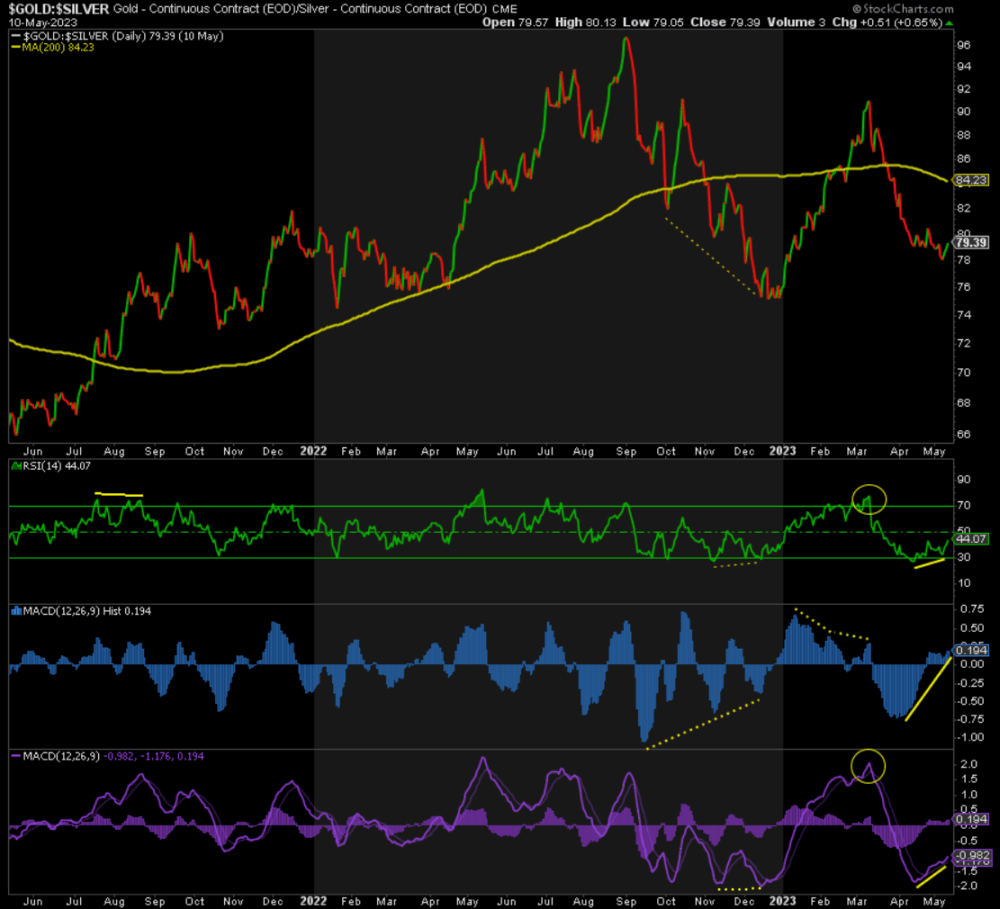
Both the RSI and the MACDs are positively divergent here, which suggests that silver will underperform gold to the downside, i.e., a short-term rebound in the GSR is more likely.
This is to be expected. silver has beta of ~1.5 to gold. This means that when gold rises, silver tends to outperform. At the same time, if gold falls, silver falls even further.
COT Positioning – Medium/Long-Term Bullish
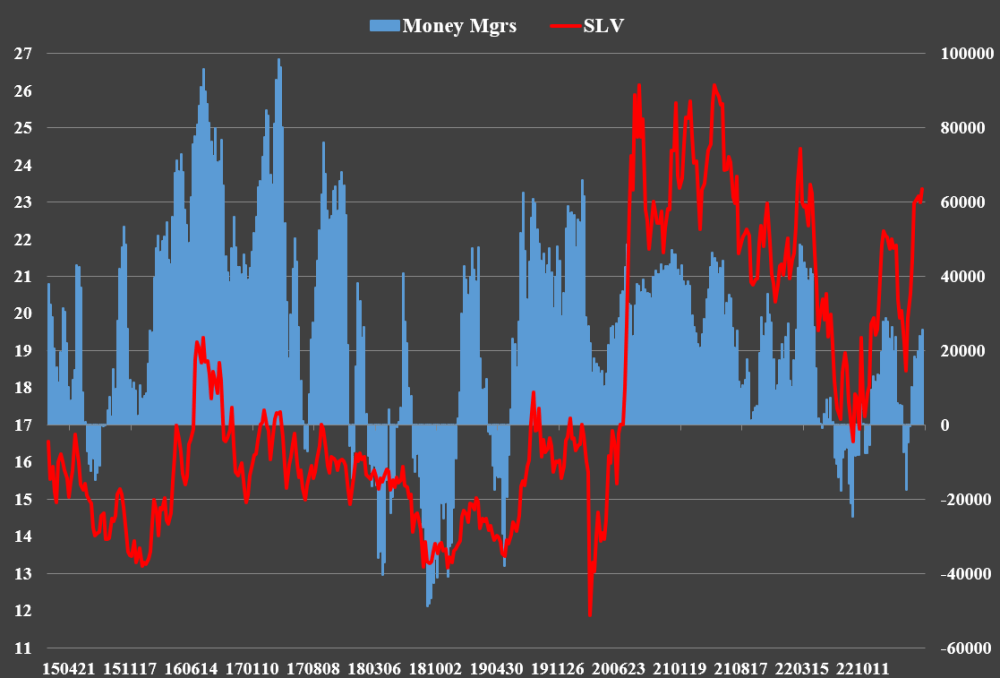
Hedge Funds are adding to their net long position, but cautiously to this point. This is also bullish because 1) The funds could triple their net long position and still not be at record highs; and 2) This makes it difficult for the banks to drive the price much lower by squeezing the longs; there aren’t enough of them. It does not negate my expectation of a deeper pullback, but it certainly limits the downside.
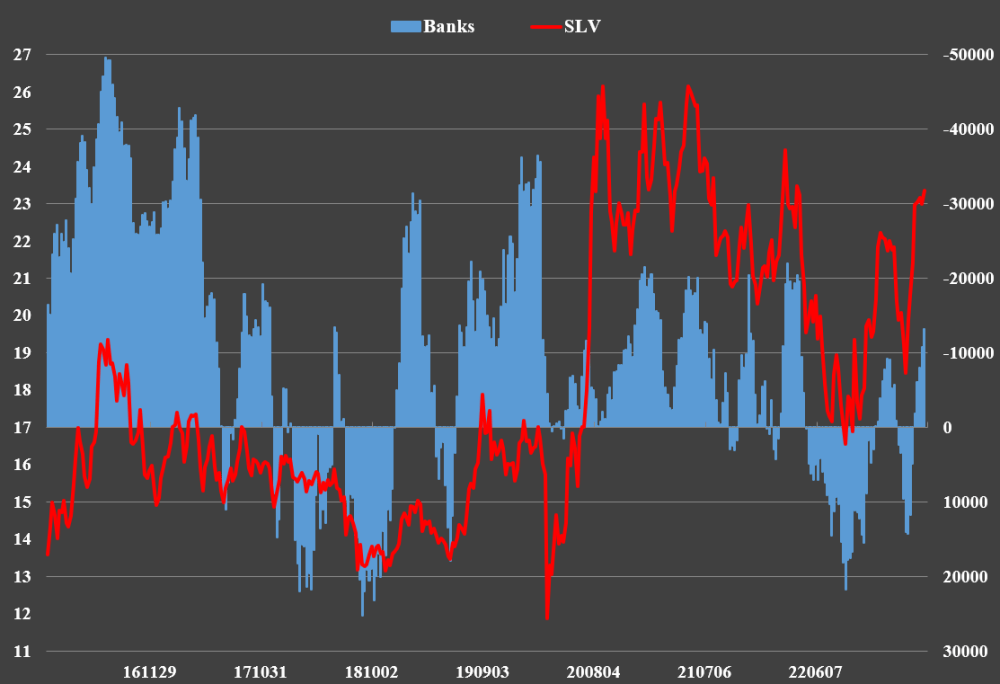
Banks are adding to the net short positions, likely in anticipation of the reversal now underway. But as fast as they are adding them – double in the past three weeks – they’re still relatively small. Look at where they were at the peak in July 2016 and in March 2020. So far, the only potential I see is a short-term pullback.
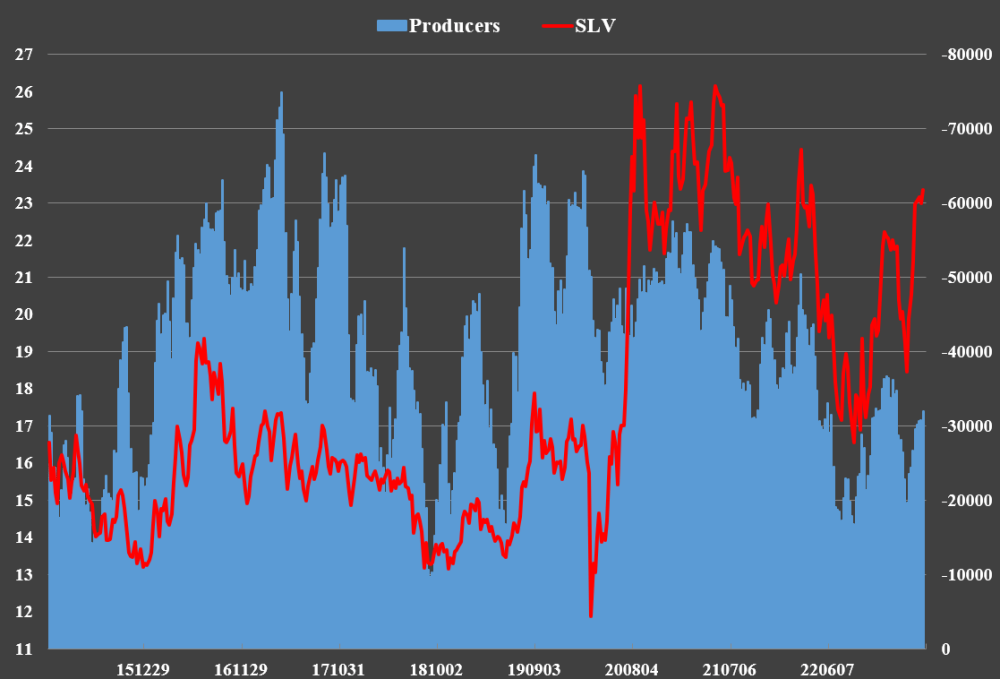
Producers are adding to their hedges as the price rises, which makes sense, but the current peak in their net short position is the lowest since 2015! While they’re hedging somewhat, they obviously believe the price is going higher from here – much higher when you look at how big their peak short positions were in March 2020 and April 2018.
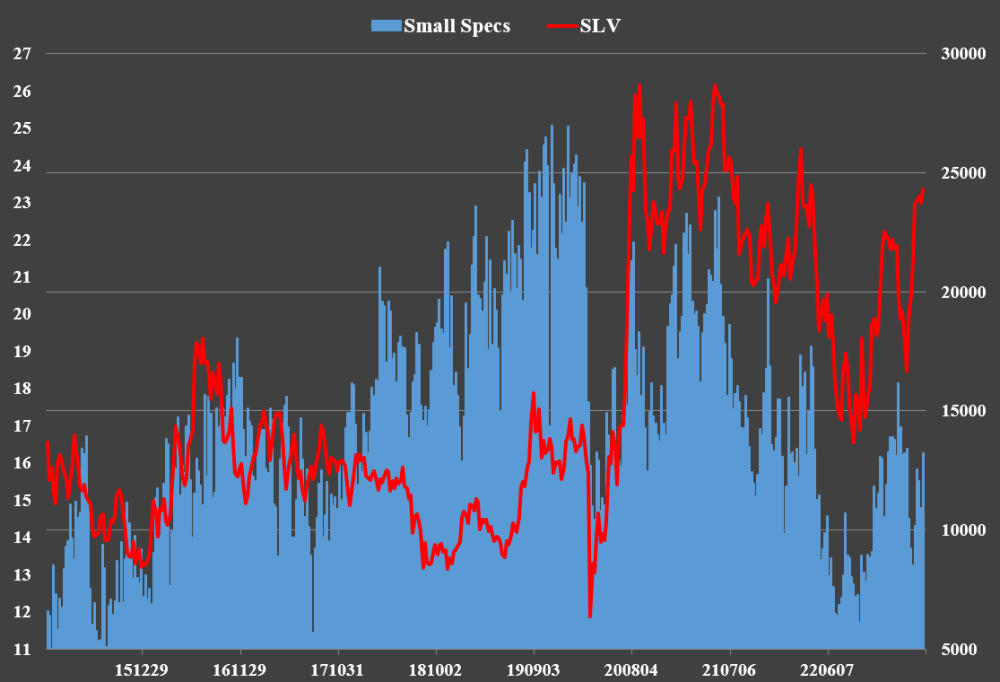
Even small speculators, i.e., us, retail, are being extremely cautious in adding to the net long position.
In summary, none of this negates further consolidation to lower prices in the near term, but it certainly supports the prospect of far higher prices going forward.
On balance, silver is likely to continue its decline and underperform gold in the process but then shoot higher thereafter. Again, much depends on how the inflation data turns out this week.
Conclusion
My process incorporates six different disciplines. It’s data-based. It has also been back-tested for all major peaks and troughs since 2006. The beauty of this process is that when all of these tools point in the same direction, you can have a high degree of confidence that you are going to be right.
As of now, we’re getting a much-needed pullback, but everything is pointing up medium term/long term in gold (and silver), and all we’re waiting for is the next low to provide the foundation for a rally that peaks far in excess of the current record high of 2089.
Editor’s Note: The summary bullets for this article were chosen by Seeking Alpha editors.