Neighbourhoods where house prices appear to be collapsing fastest can today be named.
Daily Mail analysis shows average prices have dipped by at least 10% since pre-Covid in nearly 140 different suburbs across England and Wales.
Somers Town in Camden, north London, which straddles Kings Cross and Euston stations, witnessed the biggest crash – down 49.9% from £1.3million in 2019 to £675,000 this year.
Using Land Registry sales figures, we tracked house sales in all 7,000 middle layer super output areas (MSOAs) – geographical areas typically home to around 10,000 residents.
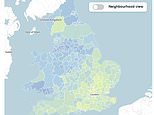
You can zoom into street level on our interactive map below to see how the market has changed in your neighbourhood.
Because the figures only reflect the median prices of homes sold in each area, the reality could be different to what our tool says.
For example, the sale of dozens of one-bed flats would skew prices in areas where three-bed homes typically go for £1million plus.
Properties in those areas may have still gone up in value, even if the average prices have fallen in our analysis.
Of the 20 MSOAs to have seen the biggest decrease since July 2019, all but one are in London.
That area, Spennymoor East & Ferryhill West in County Durham, ranked sixth.
Behind Somers Town at the top of the table was the Borough and Southwark Street corner of the capital.
In that inner-city suburb, median house prices decreased 44.9%, from £1.14m in the year ending July 2019 to £625,000 in July just gone.
The iconic Abbey Road neighbourhood came third (-44.3%).
Rounding out the top five was the St John’s Wood North area of Westminster (-41%) and the Barnsbury West area of Islington (-39.2%).
Experts believe that the Chancellor’s tax crackdown on non-doms and second homes, coupled with hikes in interest rates, are behind the price stuttering across some of the most iconic neighbourhoods.
Rachel Reeves scrapped the old non-dom scheme which allowed individuals living in Britain but domiciled overseas to avoid paying tax on income from abroad for up to 15 years. It was replaced by a scheme that allows new arrivals to avoid taxes on foreign income for their first four years of residency.
Ms Reeves announced anyone buying an additional property will have to pay a 5% surcharge, up from 3% before last autumn’s Budget.
This combination of factors has forced wealthy international buyers out of the central London property market, reducing demand and therefore prices, say experts.
Interest rates, which have more than quadrupled from 0.75% in 2019 to 4% today, also play a part in demand.
Lucian Cook, head of residential research at Savills told the Daily Mail: ‘London has higher house price to income ratios so is more sensitive to interest rate changes.’
Rising interest rates hit the priciest housing markets hardest because buyers there already spend a big chunk of their income on mortgages.
When borrowing costs climb, monthly repayments soar, pushing many out of the market.
With demand drying up fastest in these high-cost areas, sellers are forced to cut prices to make a sale, making expensive neighbourhoods the most vulnerable to a downturn.
However, areas with better affordability can see prices push up more as there is more demand. Mr Cook explained: ‘The markets in the Midlands, North, and Scotland are stronger, with more capacity to extend house prices as affordability is less stretched and can withstand higher rates.
‘That will align with the rise of house prices in Manchester.’
Figures from the Office for National Statistics (ONS) show that, in parts of London, the average home is more than 20 times the average salary.
Despite the plight of the Somers Town area, when broken down by local authority, Camden logged the biggest total annual increase in average house price in the UK, jumping £50,800 (5.8%) to just over £920,000.
Bromley, in the south-east of the capital, saw the highest percentage rise in London of 8.4% – or an increase of £41,800 to £539,000.
But it was not a city-wide trend. Of the 32 London boroughs and the City of London, 20 saw an increase in house prices, but 13 lost out.
Kensington and Chelsea, home to some of the most exclusive properties in the UK, saw properties fall by £34,300, or 2.5%.
But the average home in the exclusive west London borough still stands at just over £1.3million.
Westminster homes also plunged 5.6%, shedding £49,000 off their value, with the average property priced at nearly £977,000.
At the other end of the scale, Old Trafford in Manchester saw a 162.2% average house price rise between 2019-2025, the highest price rise across England and Wales.
Homes were selling for an average of £114,500 pre-pandemic and have since flown up to £300,000.
The findings come as property experts Rightmove last week that the annual rate of house price inflation has turned negative for the first time in more than 18 months.
The average asking price of a property coming to market across England and Wales in September was £370,257 – 0.1% lower than the year before.
This despite the the number of homes available for sale reaching a ten-year high.
In the South West, prices are down by 1.3% year-on-year while the North West has seen a 3.2% rise.
House sales in MSOA neighbourhoods can vary drastically month by month, so our analysis aggregates them annually to July of this year.