
Benzinga explains the various measures used by smart investors to measure risk and return more accurately.
Investing is about getting the most bang for your buck. Average investors chase high returns, but the smart money knows it’s not just about how much you make; it’s about how much you keep after accounting for the risks you took to get there.
But how do you measure these risks? Knowing how much risk you’re taking on goes beyond just a gut feeling — it involves an array of ratios and calculations that can help you get a better sense of what exactly is going on with your investment.
Here’s all you need to know about the various ways to measure your portfolio’s risk-adjusted return, and why it matters for you as an investor.
What is Risk-Adjusted Return?
Asset management firm BlackRock defines risk-adjusted return as: “a calculation of the return (or potential return) on an investment such as a stock or corporate bond when compared to cash or equivalents…often presented as a ratio, with higher readings typically considered desirable and healthy.”
But what does this mean? For new investors, the numbers behind calculating risk-adjusted return can be daunting to wrap your mind around. Here’s an example to get you thinking the right way before all the math.
Imagine you’re at a fairground, and you have a choice between two games. One game is a simple ring toss with a modest prize, while the other is a challenging basketball shoot-out with a huge stuffed animal as the reward. You’re good at both, but you know the ring toss is less risky — you’re almost certain to win, while the basketball game is a bit of a gamble.
In this scenario, playing the ring toss is akin to a low-risk investment with modest returns. The basketball shoot-out, on the other hand, represents a high-risk investment with potentially high rewards. What if you could measure how much better one game is over the other, taking both the risk and the reward into account?
That measurement is your risk-adjusted return. It helps you decide which game — or investment — is truly worth your time and money, offering the best bang for your buck.
Risk-adjusted return is a calculation that helps you assess different investments on an even playing field, allowing you to compare them head-to-head regardless of their individual risks and rewards. Higher risk-adjusted returns mean you’re getting more reward for each unit of risk you take on, making your investment decision smarter and more informed.
Understanding the Relationship Between Risk and Return
In the investment world, the potential for higher returns usually comes with higher levels of risk. However, not all risks are created equal, and it’s essential to differentiate between the types of risks you might encounter.
- Systematic risk (market risk): This is the risk inherent to the entire market or a broad segment of it. For taking on systematic risk, investors expect to be compensated with higher returns because it’s a risk that can’t be diversified away. In essence, if the entire market goes south, there’s no hiding from systematic risk, and so investors demand a premium for taking it on.
- Unsystematic risk (idiosyncratic risk): This is the risk associated with a specific company or industry. Unsystematic risks don’t offer any compensatory return. That’s why smart investors diversify their portfolios — to eliminate or minimize this type of risk. The idea is that the poor performance of one investment could be offset by the strong performance of another, effectively diversifying away the unsystematic risk.
This brings us to the Capital Asset Pricing Model (CAPM), which specifically focuses on how investors are compensated for taking on systematic, non-diversifiable risk.
According to CAPM, the return you should expect from an investment is essentially the risk-free rate (like the yield on a Treasury Bill) plus a premium for the systematic risk you’re taking on. The level of this systematic risk is measured by the asset’s beta. The exact formula is:
Expected Return = Risk-Free Rate + Beta × (Market Return − Risk-Free Rate)
The CAPM formula tells you the minimum return you should accept for the amount of systematic risk you’re taking. If an investment offers a return below this, it likely means you’re not being adequately compensated for your risk.
Common Risk-Adjusted Return Calculations
While the CAPM lays the groundwork for understanding the relationship between risk and return, it’s just the tip of the iceberg. Investors have many tools to calculate risk-adjusted returns, each offering unique insights and tailored for specific scenarios.
Below are some of the most used risk-adjusted return ratios. While the math of each may seem complex it involves little more than simple addition, subtraction, division and multiplication, and investors can automate much of the data collection and calculation via tools offered online or on their brokerage platform.
Sharpe Ratio
The Sharpe Ratio measures the return of an investment relative to its volatility. The formula is:
Sharpe Ratio = (Investment Return – Risk-Free Rate) / Standard Deviation of Investment’s Returns
Here, the Investment Return is the average return of the investment, and the Risk-Free Rate is usually the yield on a Treasury Bill. The standard deviation represents the investment’s volatility, showing how much it fluctuates from the average return.
The Sharpe Ratio is useful for comparing the risk-adjusted performance of various investments or portfolios. A higher Sharpe Ratio is better and implies that you are getting more return for each unit of risk taken.
Sortino Ratio
The Sortino Ratio is like the Sharpe Ratio but focuses only on downside volatility. The formula is:
Sortino Ratio = (Investment Return – Risk-Free Rate) / Downside Standard Deviation of Investment’s Returns.
The Sortino Ratio is advantageous when you want to penalize only the negative volatility, not the overall volatility which includes upside fluctuations. This ratio is useful for investors who are more concerned with the downside risks.
Treynor Ratio
The Treynor Ratio focuses specifically on systematic (market) risk and is calculated as:
Treynor Ratio = (Investment Return – Risk-Free Rate) / Beta
Here, Beta is the measure of the investment’s sensitivity to market-wide risk.
The Treynor Ratio allows you to understand how much excess return you’re generating for each unit of systematic risk you’re taking on. This ratio is particularly useful for diversified portfolios where unsystematic risk has been minimized but market risk is still present.
Calmar Ratio
The Calmar Ratio measures returns against the maximum drawdown an investment has experienced. The formula is:
Calmar Ratio = Annualized Rate of Return / Maximum Drawdown
Here, Maximum Drawdown represents the largest single drop from peak to bottom in the value of a portfolio.
The Calmar Ratio is useful for investors who are concerned with large, sudden drops in their investments, as it considers the worst-case scenario of investment performance.
Other Risk-Adjusted Return Measures
Beyond the four primary ratios often used to assess risk-adjusted returns, investors have a host of other metrics that provide various perspectives on investment performance and risk. These metrics can be invaluable for a more nuanced understanding of your portfolio.
Alpha
Alpha measures the excess return of an investment or portfolio above its expected return based on its level of risk, as determined by CAPM. The formula is:
Alpha = Actual Portfolio Return – Expected Portfolio Return Based on CAPM
Alpha is a gauge of investment skill or strategy, telling you how well the investment has performed compared to its risk-adjusted expectations. A positive alpha indicates that the investment has performed better than expected for its level of risk.
Beta
Beta measures how sensitive an investment has historically been to market risk. In other words, it measures the direction and magnitude that an investment tends to move with the market. The formula is:
Beta = Covariance (Investment Return, Market Return) / Variance (Market Return)
A beta of 1 implies that the investment moves in line with the market, both in direction and magnitude.
A beta greater than 1 not only suggests that the investment is more volatile than the market but also that it tends to amplify the market’s movements in the same direction.
A beta less than 1 indicates that the investment is less volatile and generally moves less dramatically in the same direction as the market.
A beta of 0 would imply that the investment is largely uncorrelated with the market, showing little to no sensitivity in either direction or magnitude relative to market movements.
R-Squared
R-squared measures the percentage of an investment’s movements that can be explained by movements in a benchmark index. It ranges from 0 to 100, with higher values indicating a closer correlation with the benchmark. The formula is:
R-squared = Explained Variation / Total Variation
R-squared is useful for determining how closely your investment mimics the behavior of a benchmark, helping to validate whether Beta and Alpha calculations are meaningful for your investment scenario.
Standard Deviation
Standard deviation measures the volatility or dispersion of an investment’s returns from its average return. A higher standard deviation implies more volatility and, therefore, higher risk. The formula is:
Standard Deviation = sqrt (Average of (Return – Average Return) ^2)
Standard deviation gives you a sense of the investment’s volatility, helping to quantify the risk you’re taking on. It’s often used as the volatility measure in various risk-adjusted return calculations, like the Sharpe Ratio.
Factors to Consider in Risk-Adjusted Return Calculations
When calculating risk-adjusted returns, it’s not merely about plugging numbers into a formula. Several factors must be taken into consideration to ensure that your analysis is accurate and meaningful. Here are some key considerations.
Time Period for Analysis
The time period for analysis refers to the span of time over which you’re assessing the risk and returns of an investment based on historical data. The chosen time period can significantly impact the risk-adjusted return calculations, as a cherry-picked time period can introduce significant biases in your results.
A longer time span may provide a more reliable indicator of an investment’s inherent risk and return characteristics, as it would capture a wider array of market conditions. A shorter time span might highlight recent trends but could also be subject to short-term market anomalies.
Therefore, it’s crucial to select a time period that aligns with your investment objectives and risk tolerance and be aware of any outliers.
Proper Benchmark Selection
A benchmark is the standard against which the performance of an investment is measured. It is usually a market index such as the S&P 500 but can also be tailored based on your objectives.
Choosing the correct benchmark is vital for making meaningful risk-adjusted return comparisons. An inappropriate benchmark can provide misleading insights. For instance, comparing the performance of a bond fund against a stock market index would not yield a meaningful analysis of its risk-adjusted returns.
Thus, the benchmark should ideally mirror the investment type, sector and other characteristics relevant to what you’re analyzing.
Importance of Accurate Data and Periodic Updates
Garbage in, garbage out. If the data you’re using is flawed, inaccurate or outdated, then the risk-adjusted returns will be misleading. Use accurate and up-to-date information to make your calculations.
Risk factors and market conditions change, so it’s equally important to update your calculations periodically to reflect the most current information. Consider the quality of the data used in calculations and the frequency with which it’s updated.
Strategies for Improving Risk-Adjusted Returns
Improving risk-adjusted returns isn’t just about picking the right stocks or timing the market perfectly; it’s also about intelligent portfolio construction and management. Here are some strategies that can help you enhance your portfolio’s risk-adjusted returns.
First up is diversification, which primarily involves spreading your investments across various asset classes, like stocks, bonds, real estate and commodities, to reduce unsystematic risk.
The core mathematical principle behind diversification is correlation. Assets that are not perfectly correlated reduce the portfolio’s overall risk because they don’t move in the same direction at the same time. This variance in behavior can offset losses in one asset class with gains in another.
By diversifying across uncorrelated assets like stocks, bonds and gold and rebalancing periodically, you can reduce your portfolio’s volatility. The lower the portfolio volatility, the better your risk-adjusted returns.
For example, these backtests show how a portfolio of 50% U.S. stocks, 30% U.S. bonds and 20% gold rebalanced annually has historically produced a higher risk-adjusted return (Sharpe Ratio of 0.60) versus a 100% U.S. stock portfolio (Sharpe Ratio of 0.52).
Source: Portfolio Visualizer
This brings us to the topic of asset allocation, which is the process of deciding how to distribute your investments among different asset classes.
The key is to find the efficient frontier, a concept from Modern Portfolio Theory, where you can’t achieve higher expected returns without taking on additional risk. Picking the right asset allocation can help you position your portfolio on the efficient frontier, ensuring it earns the maximum possible return for a given level of risk or the lowest risk possible for a target return.
For example, the following backtest shows that from 1987 to 2023, the efficient frontier for a portfolio of U.S. stocks, U.S. bonds and gold would have been an allocation of 21.93% stocks, 74.3% bonds and 3.77% gold. In other words, this portfolio composition would have maximized your returns for a given level of risk, placing you on the efficient frontier.

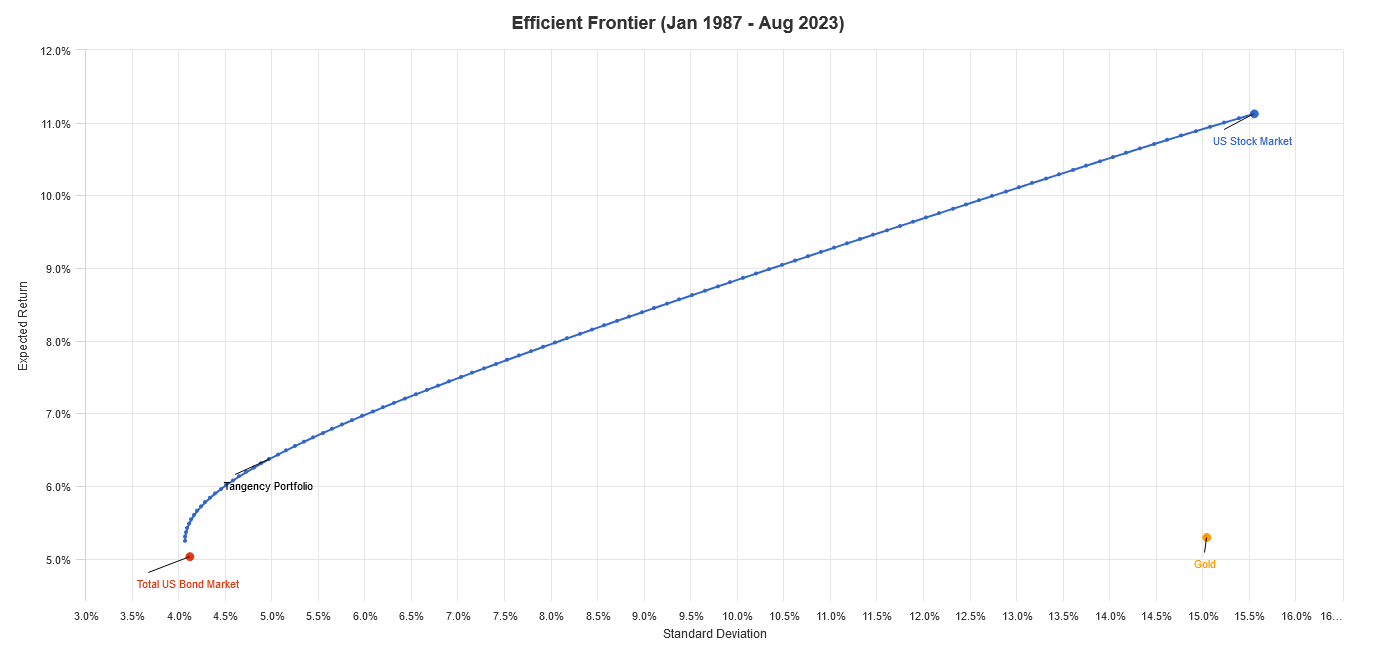
Source: Portfolio Visualizer
Why Risk-Adjusted Returns Matter
Risk-adjusted returns serve as a more nuanced and comprehensive measure of an investment’s performance compared to raw returns. They’re not just an academic concept but also a practical tool for intelligent investing.
Understanding and calculating ratios that measure risk-adjusted returns, such as the Sharpe ratio, allows investors to better visualize their portfolio’s level of risk.
In turn, this helps investors make more objective investment decisions, from selecting the right mix of assets to implementing strategies like diversification and rebalancing.
Ultimately, this should help investors create portfolios that are not only potentially more profitable but also aligned with their risk tolerance.
Frequently Asked Questions
A
While the Sharpe ratio is one of the most widely used measures for calculating risk-adjusted returns, it is not the only one. Other metrics like the Sortino ratio, Treynor ratio and Calmar ratio provide different perspectives on risk-adjusted performance. Risk-adjusted return is not synonymous with the Sharpe ratio, although the latter is a popular method for its calculation.
A
The definition of a good risk-adjusted return ratio can vary depending on your investment objectives and risk tolerance. However, when looking at the Sharpe ratio specifically, a ratio above 1 is generally considered good, above 2 is very good, and above 3 is excellent. These numbers serve as a general guideline; the higher the Sharpe ratio, the better the risk-adjusted return.
A
The answer to this question can depend on various factors such as time period, market conditions and liquidity constraints. However, real estate investment trusts (REITs) have generally provided competitive risk-adjusted returns. They offer the advantage of liquidity and diversification compared to direct real estate investments, making them an attractive option for achieving better risk-adjusted returns.