
Jeremy Poland
Introduction
Houston-based W&T Offshore, Inc. (NYSE:WTI) released its first quarter 2023 earnings report on May 9, 2023.
Note: I have been covering W&T Offshore regularly quarterly since May 2016. This article is an update of my preceding article, published on March 12, 2023.
The company specializes in oil & gas production in the Gulf of Mexico, with production in the Gulf of Mexico Shelf (381K acres net) and the Gulf of Mexico Deepwater (72K acres net).
WTI Corporate Overview (WTI Presentation May)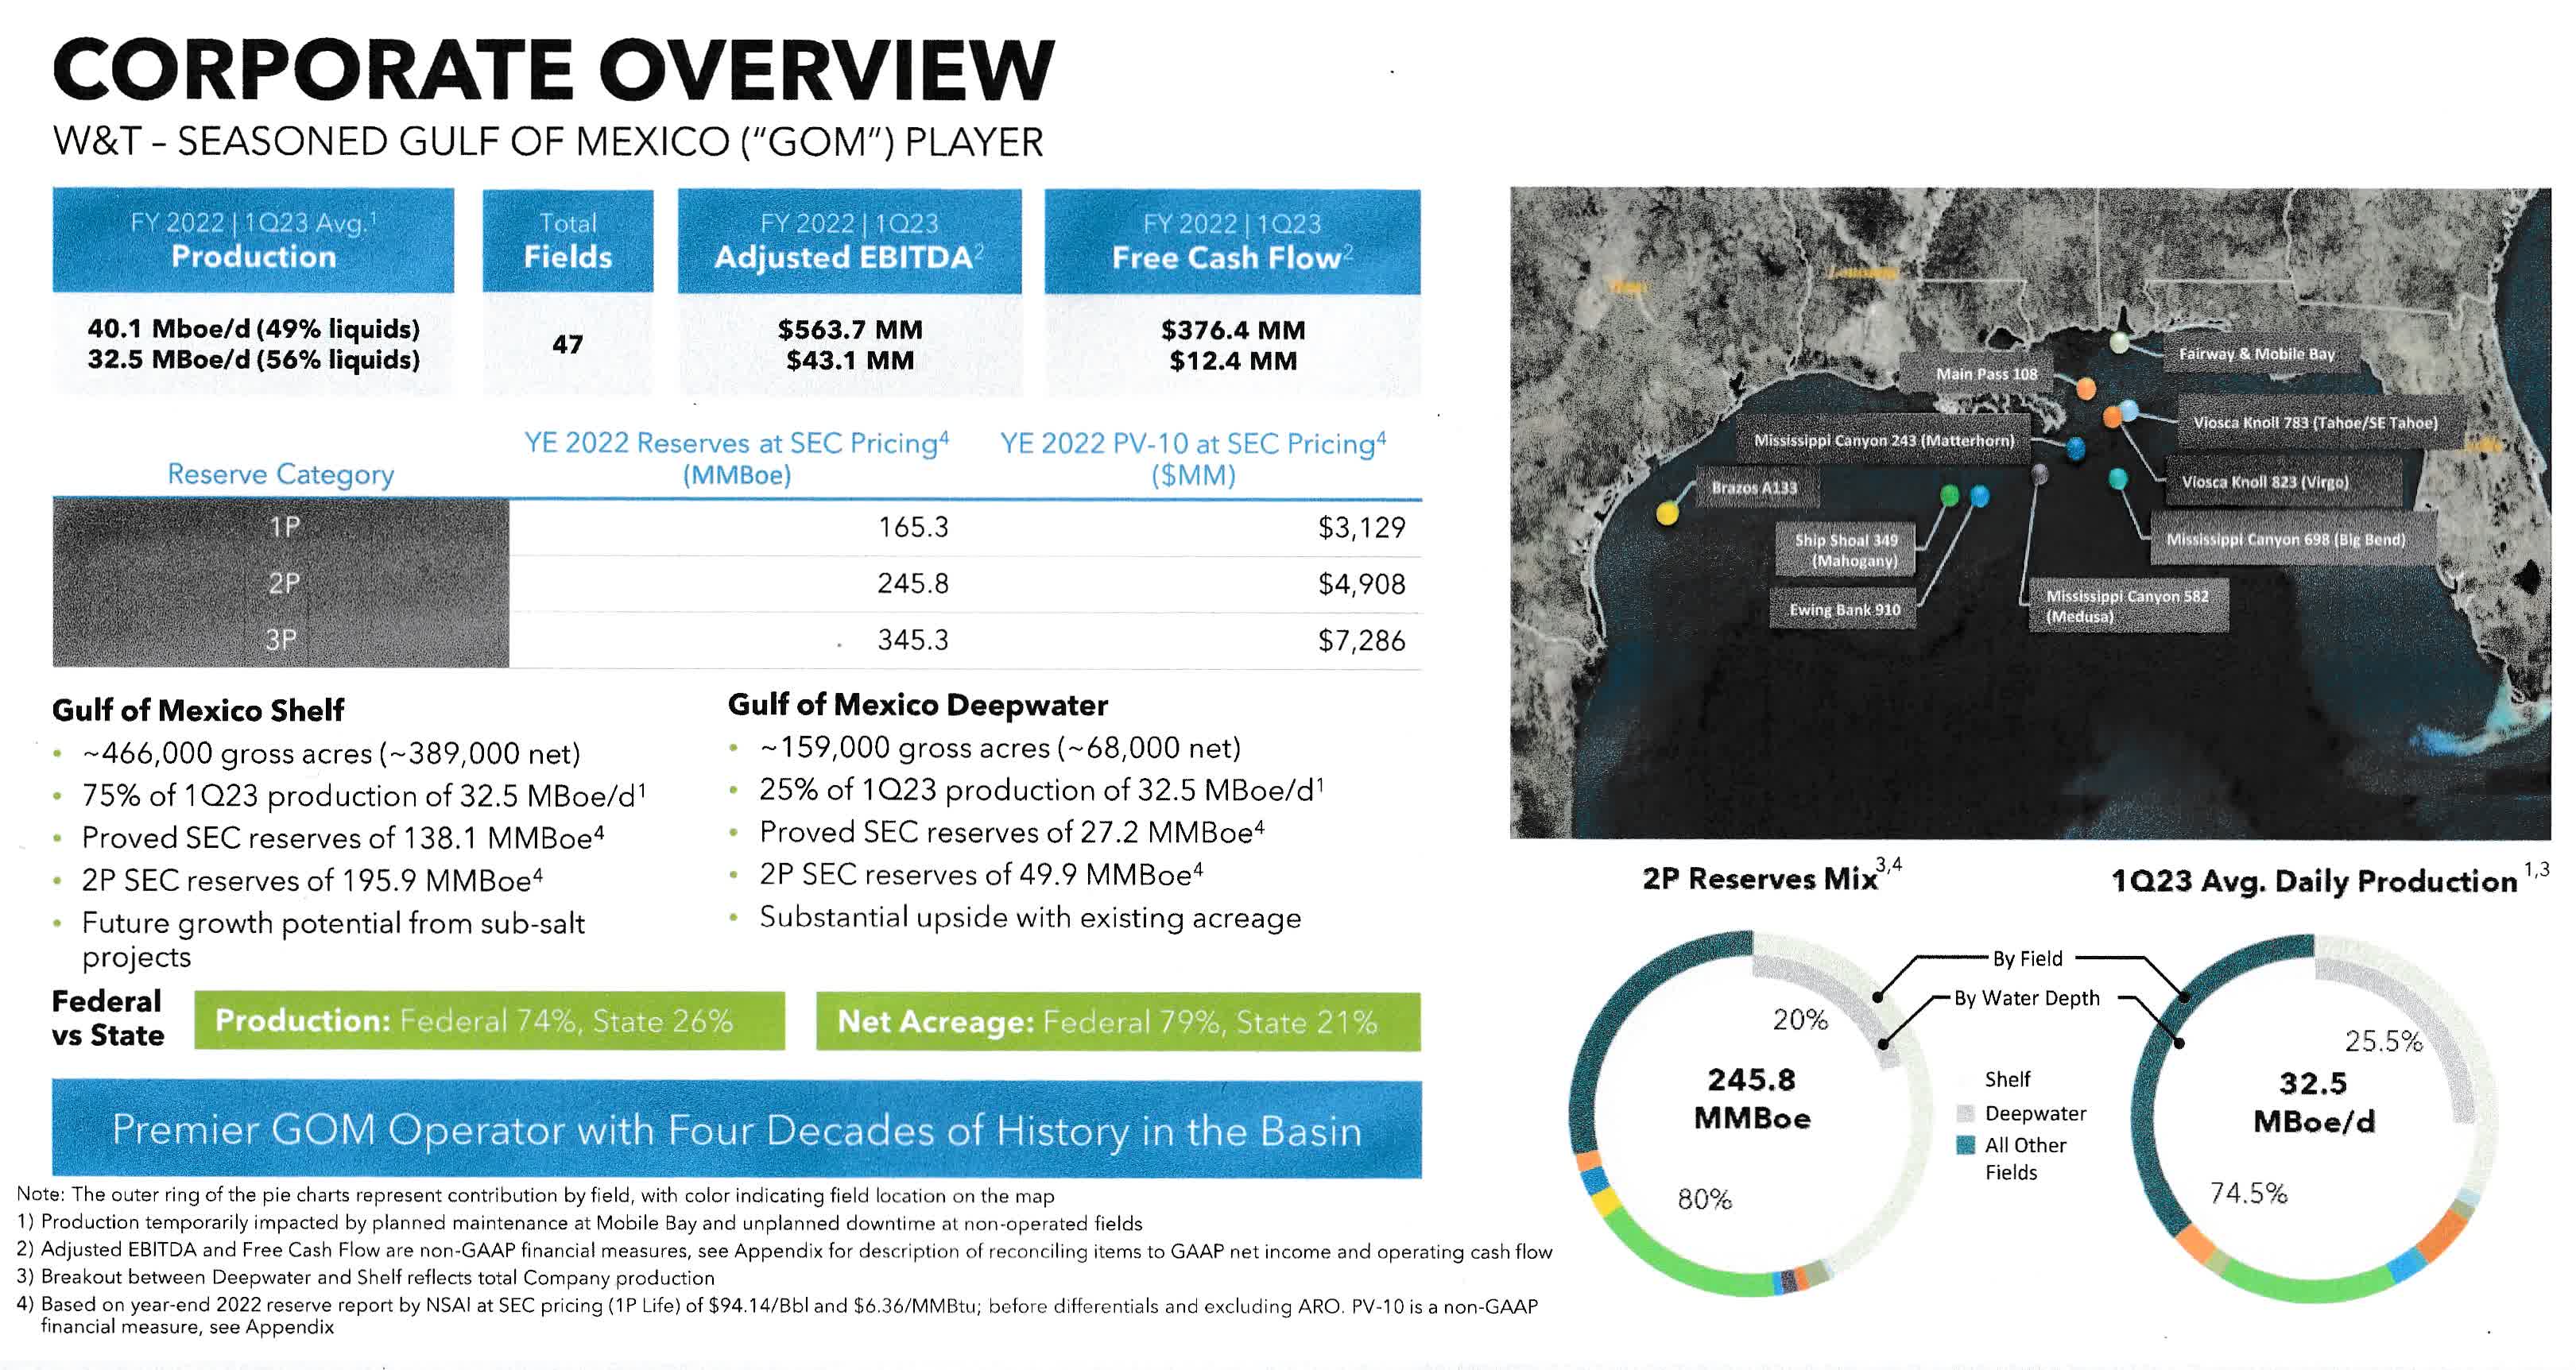
1 – Q1’23 result snapshot
The Company came out with $26.01 million or $0.17 per diluted share. It compares with a loss of $2.46 million or $0.02 per share a year ago. The adjusted earnings were a loss of $0.02 per share or $2.412 million.
Total revenues were $131.73 million, down 31% from $191.0 million earned a year ago.
WTI 1Q23 Highlights (WTI Presentation)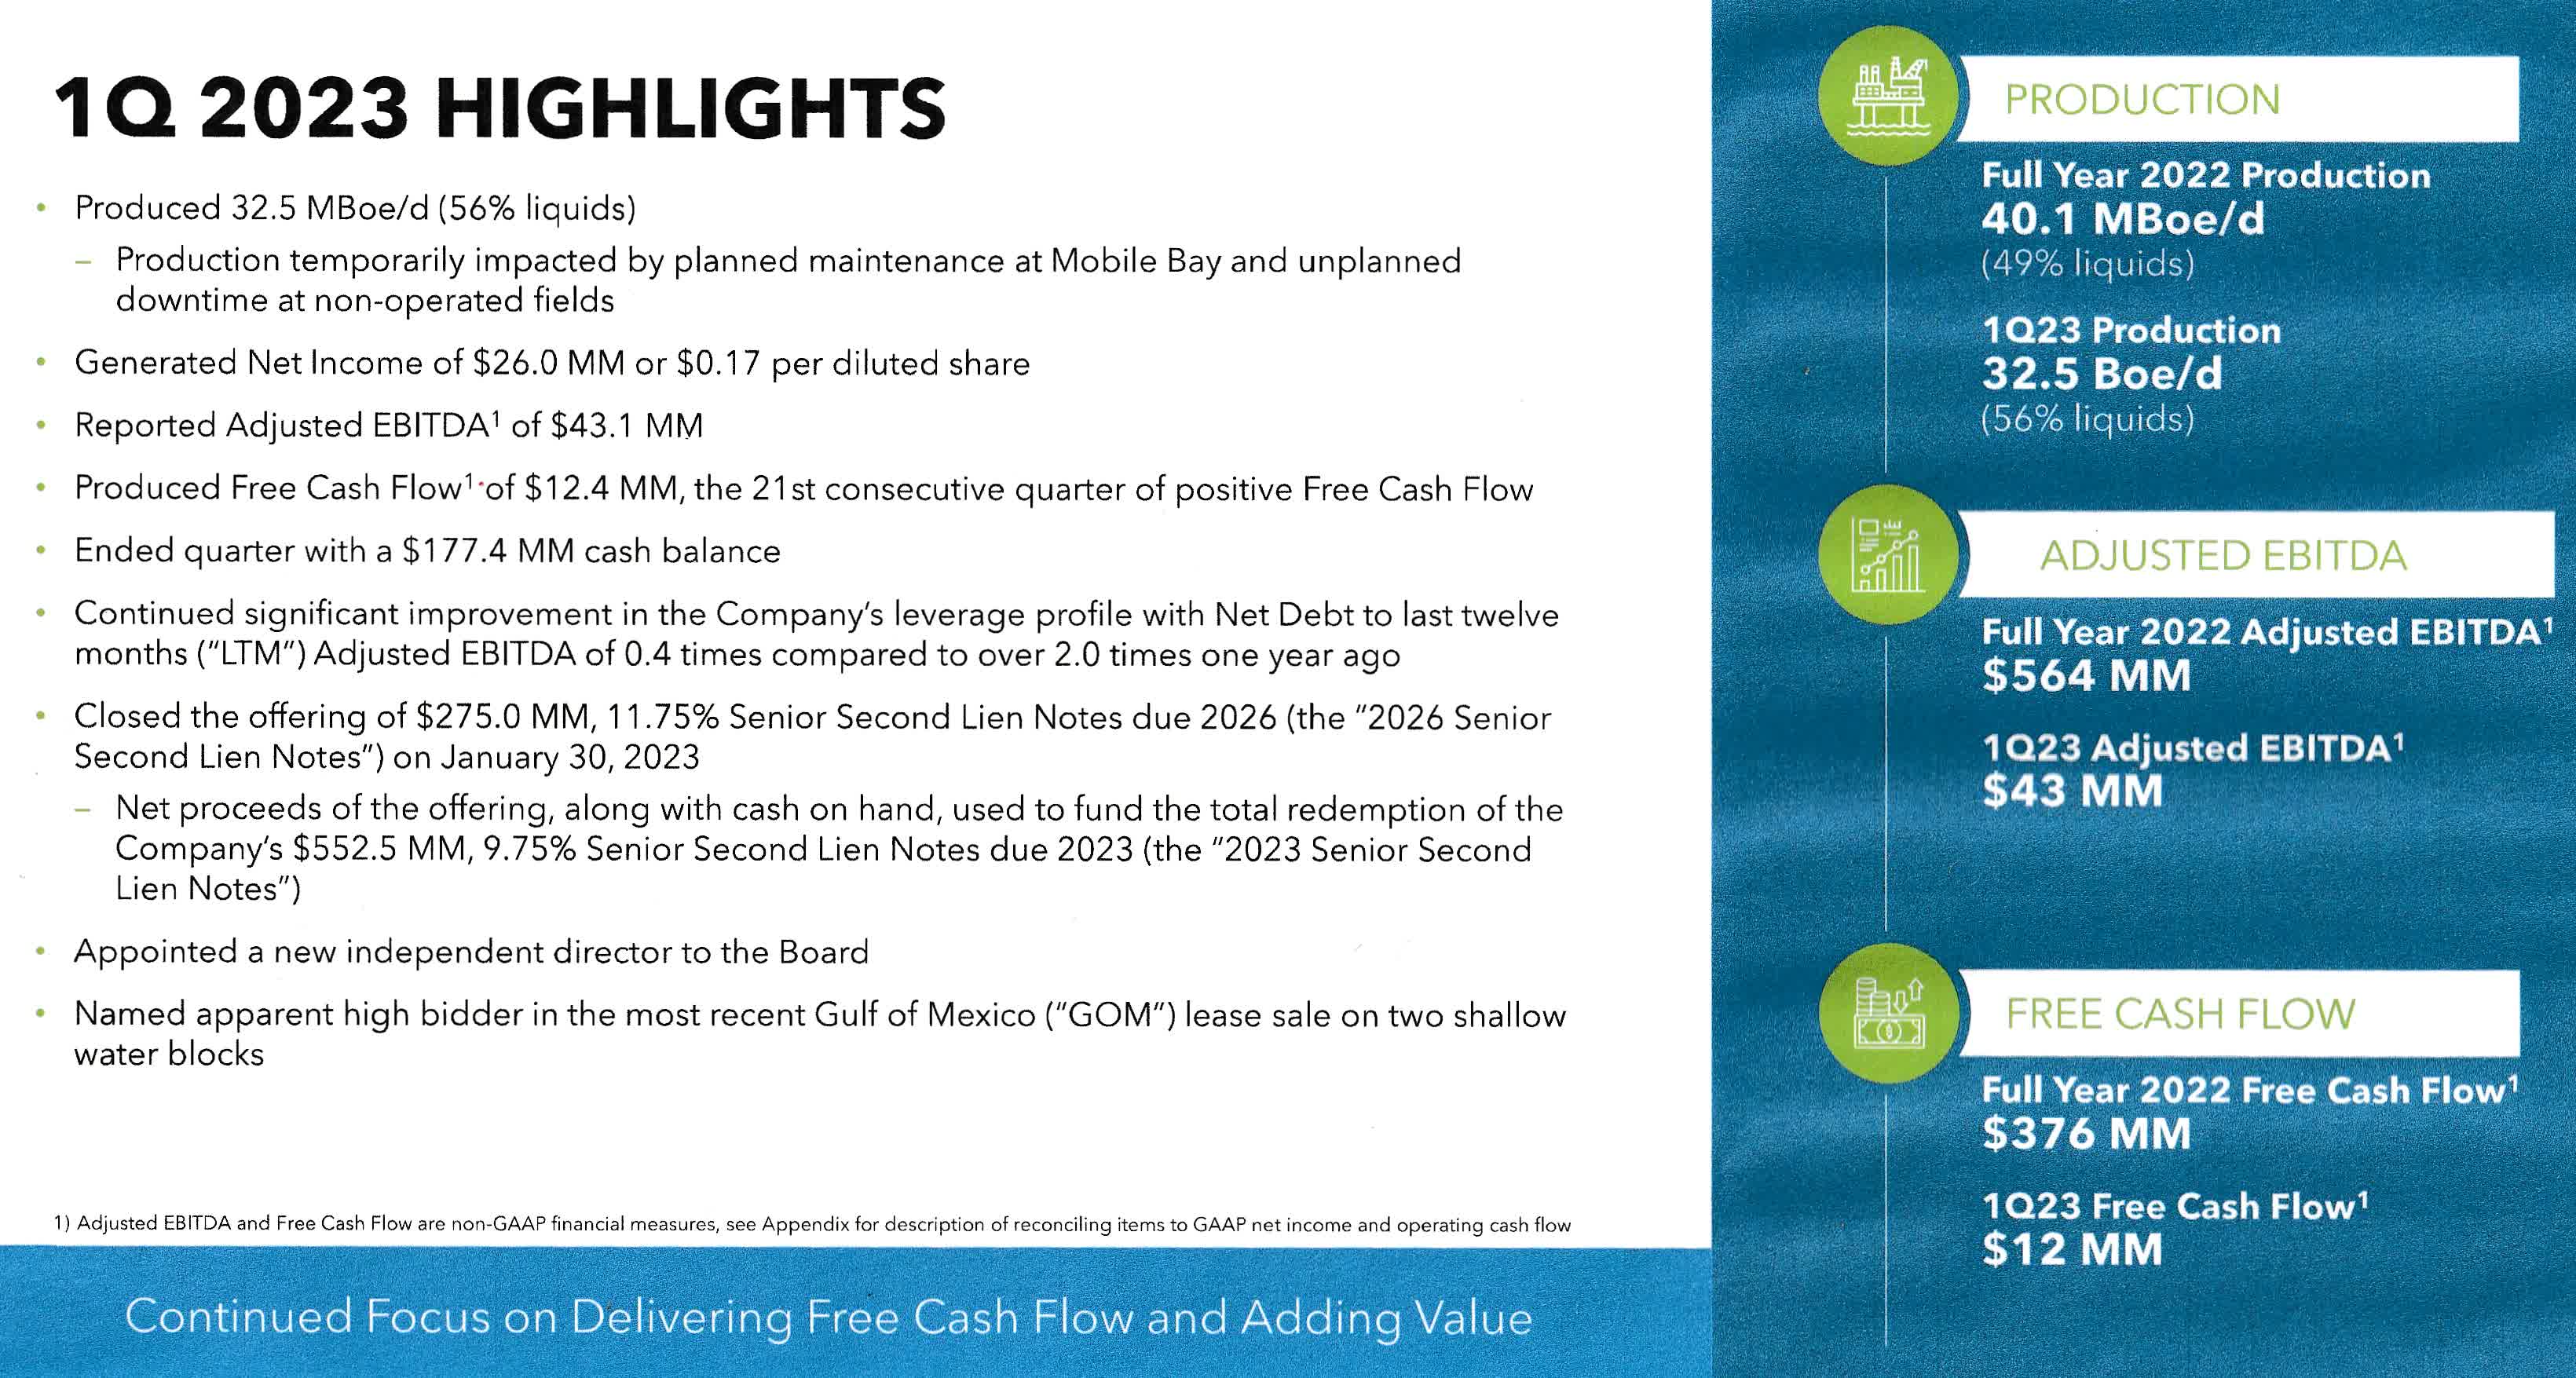
Tracy W. Krohn, Chairman, and Chief Executive Officer, said in the conference call:
We began 2023 by redeeming all of our outstanding 2023 second lien notes and issuing new 2026 second lien notes. — significantly reducing our debt and interest payments moving forward while strengthening our balance sheet and moving forward our debt maturities. We also delivered another quarter of free cash flow generation and strong adjusted EBITDA generation.
Oil equivalent production was 32.5K Boep/d in 1Q23, with 56.2% liquids. The average price per $/boe was $44.32 per Boe, well below the $55.29 made last year. Natural Gas production is down significantly compared to 1Q22.
WTI Quarterly Production per Segment 1Q22 versus 1Q23 (Fun Trading)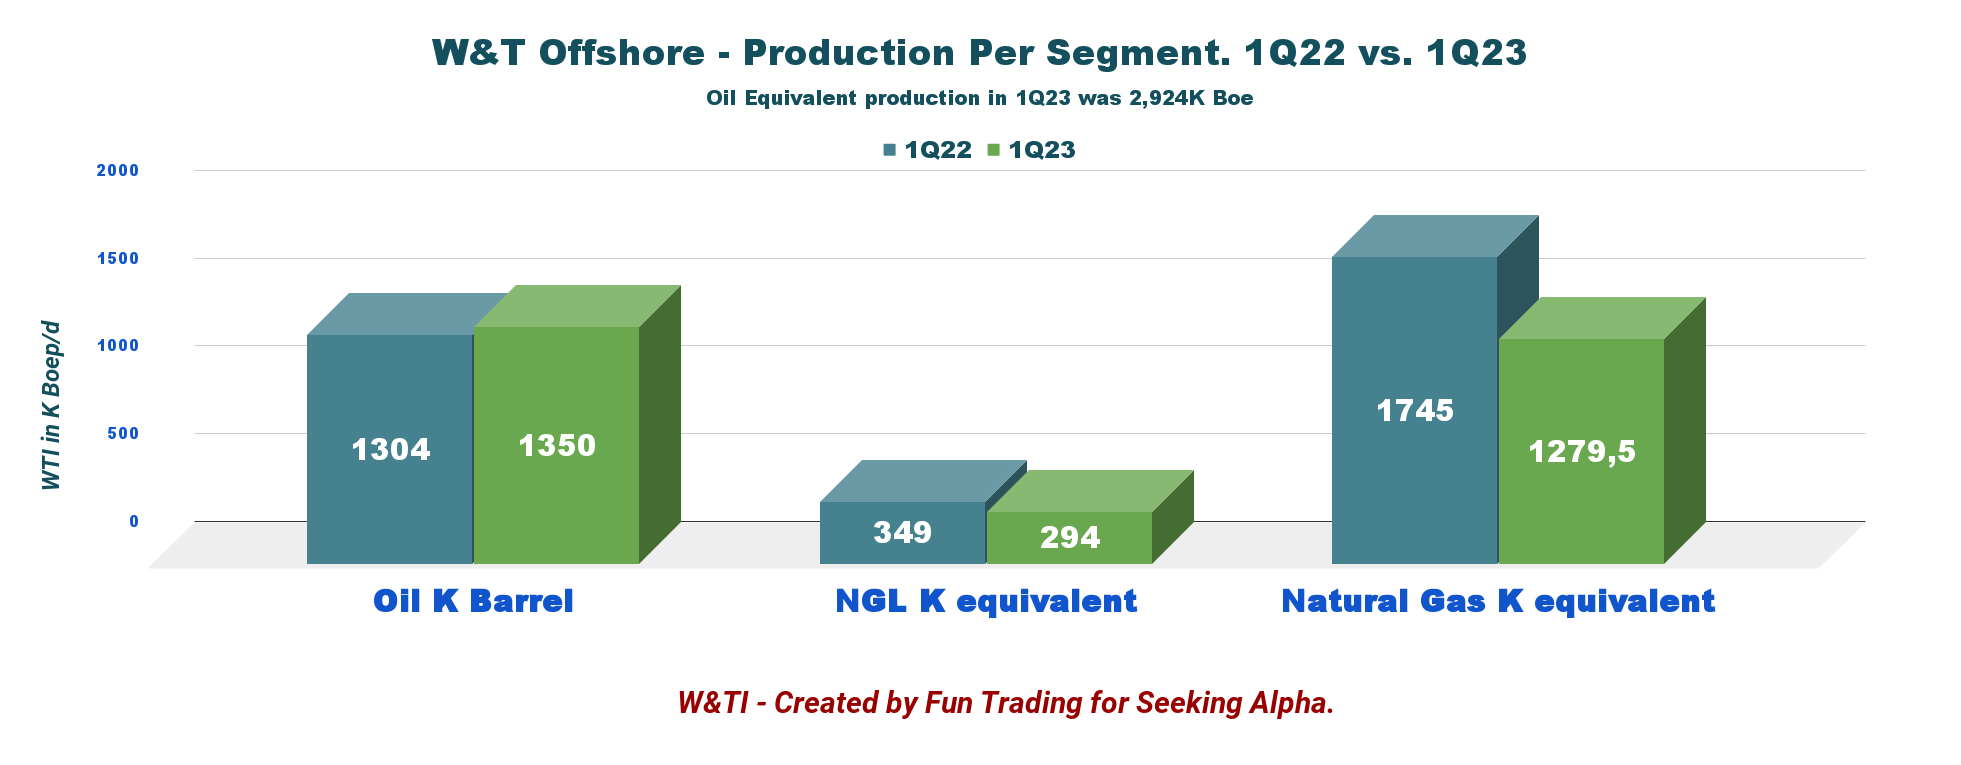
As I always warn new potential investors about the extreme volatility attached to W&T Offshore, a small domestic E&P company unsuitable for long-term investment. Also, the company is not paying dividends, which is a strong deterrent.
Another crucial issue is that natural gas prices declined significantly during 2023, likely hurting free cash flow in the next few quarters. NG prices are barely above $2 per Mcf. W&T Offshore production is comprised of 43.8% natural gas.
WTI 1-Year Brent and NG price (Fun Trading StockCharts)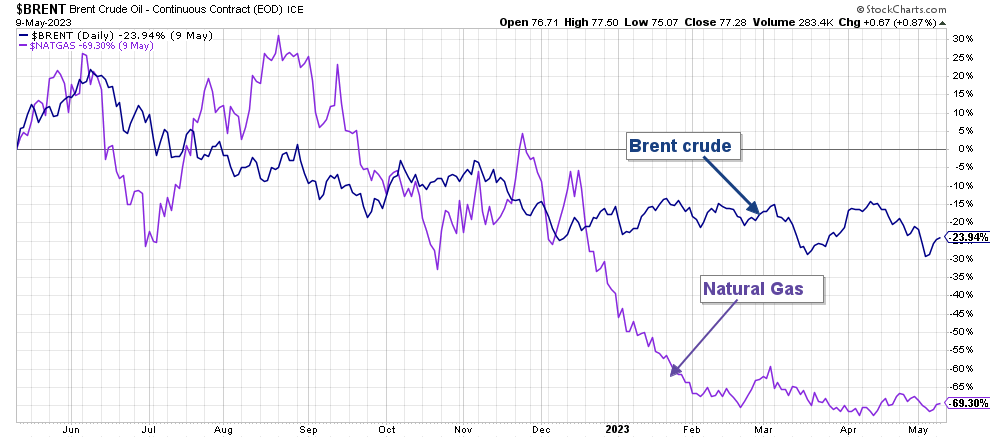
Thus, the best trading/investing strategy is to trade short-term LIFO the volatility and keep a medium core long-term position for an eventual higher payday. In my opinion, this simple dual strategy is the most rewarding and safest way long-term, and is what I advise in my marketplace, “The Gold And Oil Corner.”
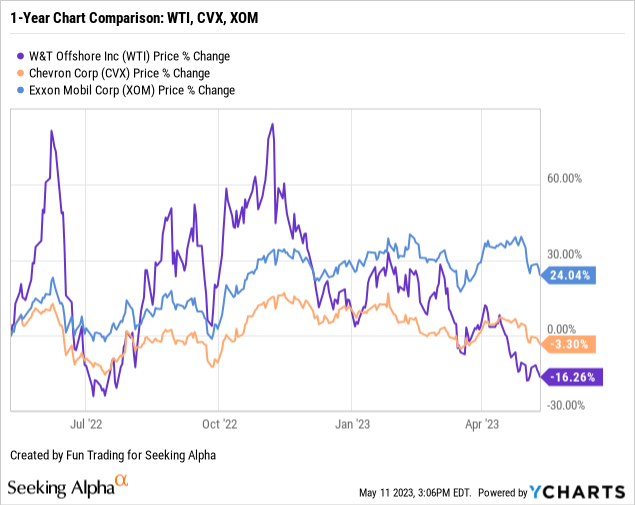
2 – Stock performance
WTI has underperformed Chevron Corporation (CVX) and Exxon Mobil (XOM) and is now down 16% on a one-year basis. A massive slide from the high in October/November 2022.
W&T Offshore, Inc. – Historical Financial and Production ending Q1’23 – The Raw Numbers
| W&T Offshore, Inc. | 1Q22 | 2Q22 | 3Q22 | 4Q22 | 1Q23 |
| Total Revenues in $ Million | 191.00 | 273.81 | 266.49 | 189.70 | 131.73 |
| Net Income in $ Million | -2.46 | 123.44 | 66.72 | 43.45 | 26.01 |
| EBITDA $ Million | 47.65 | 207.07 | 134.08 | 99.08 | 81.49 |
| EPS diluted in $/share | -0.02 | 0.85 | 0.46 | 0.30 | 0.17 |
| Cash from operations in $ Million | 27.54 | 210.22 | 89.09 | 12.68 | 23.44 |
| Capital Expenditure in $ Million | 47.59 | 25.52 | 8.33 | 11.75 | 7.52 |
| Free Cash Flow in $ Million | -20.06 | 184.70 | 80.77 | 0.93 | 15.91 |
| Total Cash in $ Million | 215.48 | 377.72 | 447.13 | 461.36 | 177.39 |
| Total LT Debt in $ Million | 720.32 | 709.17 | 701.42 | 693.44 | 403.27 |
| Shares outstanding (diluted) in Million | 142.94 | 144.53 | 145.88 | 146.27 | 148.73 |
| Oil Production | 1Q22 | 2Q22 | 3Q22 | 4Q22 | 1Q23 |
| Oil Equivalent Production in K Boepd | 37.8 | 42.4 | 41.5 | 38.6 | 32.5 |
| Realized price ($/Boe) | 55.29 | 69.55 | 68.39 | 52.82 | 44.32 |
Source: Company news
Analysis: Revenues, Earnings Details, Net Debt, Free Cash Flow, And Oil-Equivalent Production
1 – Total Revenues of $131.73 million in Q1’23
WTI Quarterly Revenue History (Fun Trading)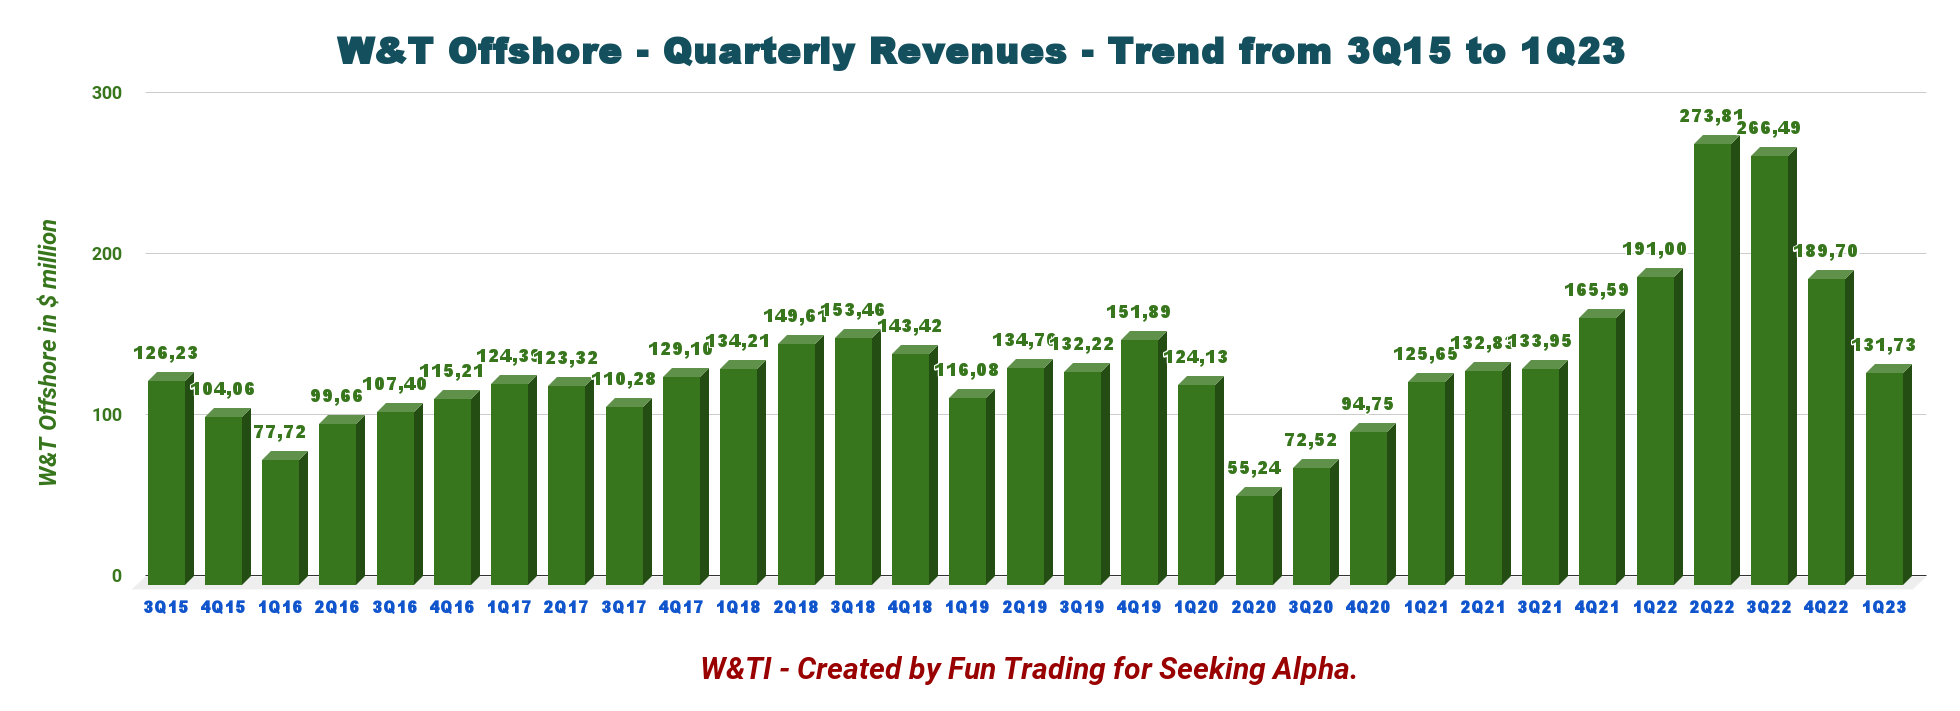
The adjusted EBITDA was $43.1 million. The Adjusted Net loss totaled $2.41 million, or $0.02 per diluted share, in the first quarter of 2023.
Oil production decreased by 15.8% sequentially.
The decrease in production was due to temporary unplanned downtime at non-operated fields. Also, extended planned downtime associated with a maintenance project at the Company’s Mobile Bay onshore treatment facility hurt production.
2 – The free cash flow was $15.91 million in Q1’23
WTI Quarterly Free Cash Flow History (Fun Trading)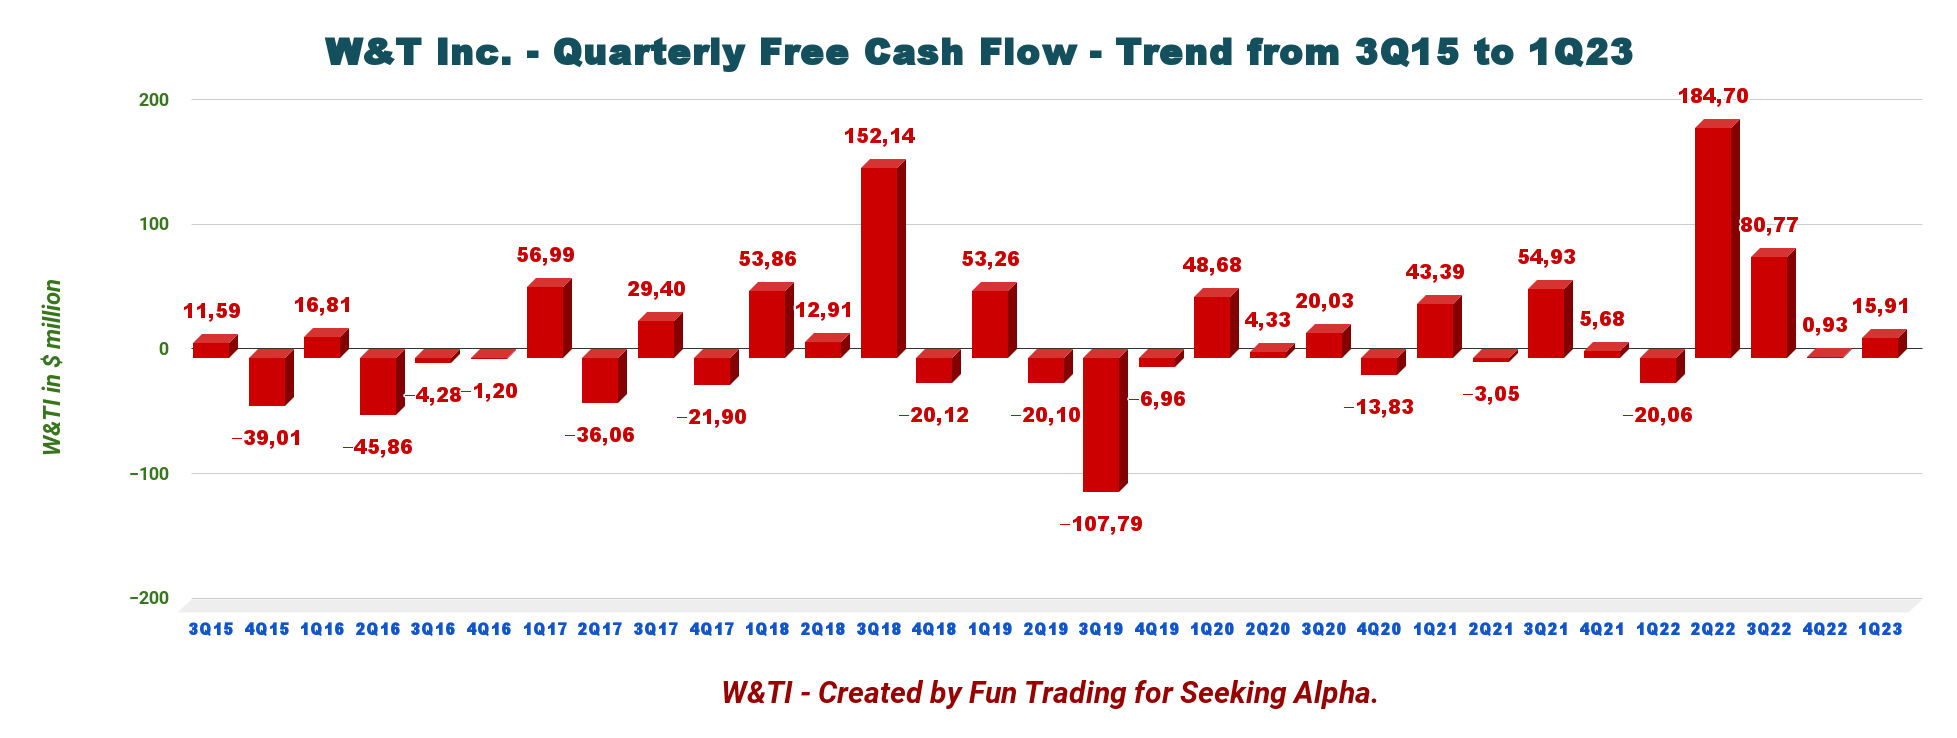
W&T Offshore’s trailing 12-month free cash flow was $282.31 million, with $15.91 million for 1Q23.
3 – Oil equivalent production and other considerations
3.1 – Oil equivalent production
WTI Quarterly Production History (Fun Trading)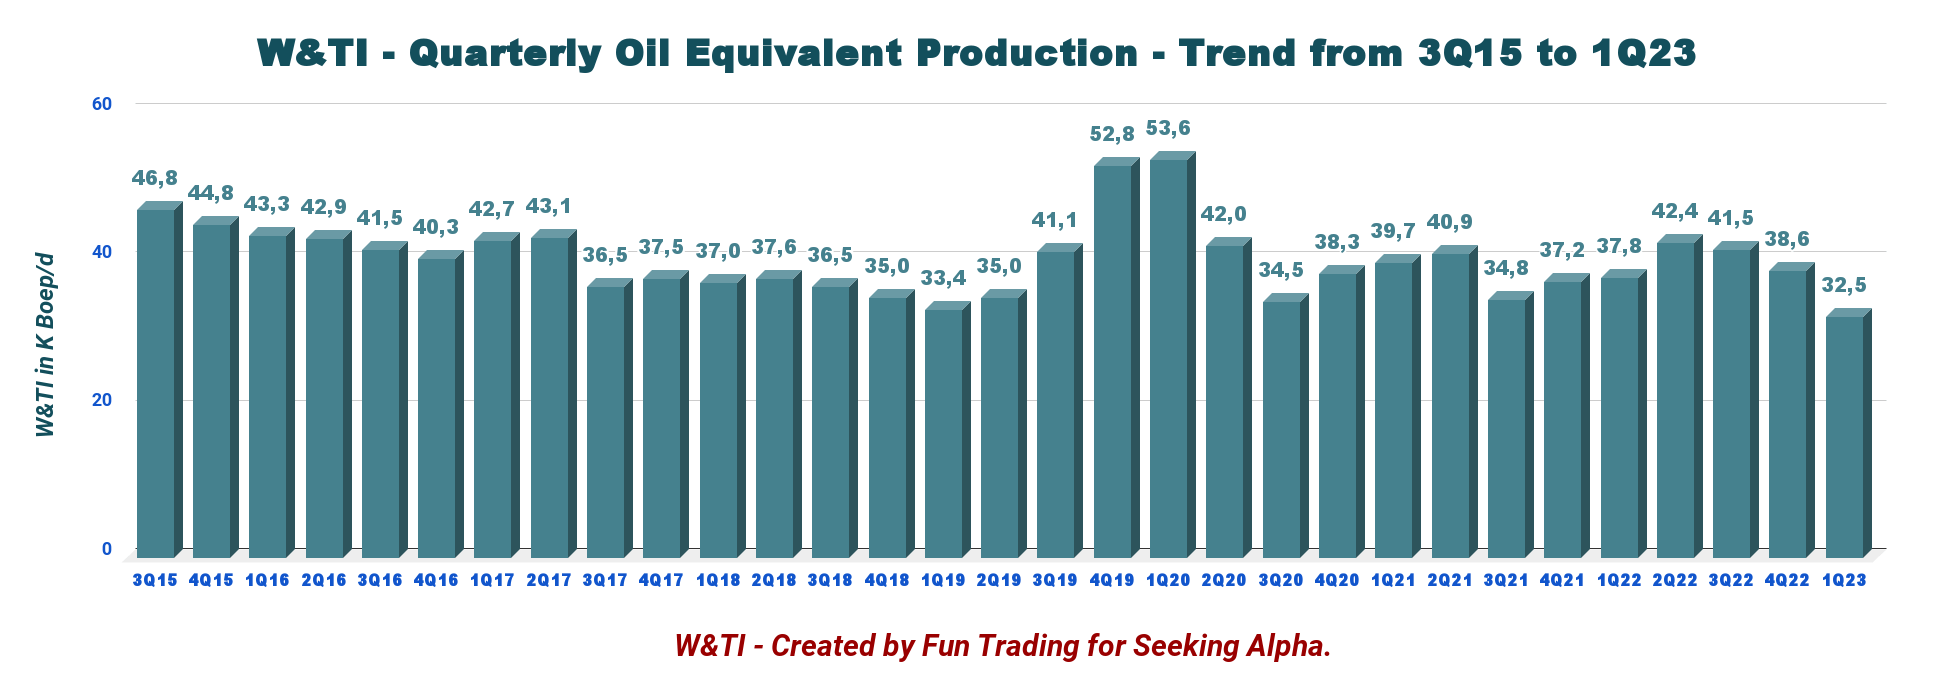
First quarter 2023 production was comprised of 15K Boep/d of oil (46.2%), 3.3K boep/d of natural gas liquids (10%) (“NGLs”), and 85.3 million cubic feet per day (“MMcf/d”) of natural gas (43.8%).
Production for the first quarter of 2023 was a multi-year low at 32.5k Boep/d. It represented a decrease of 15.8% compared to 4Q22 and was down 14% for the corresponding period in 2022.
3.2 – Details revenues QoQ:
WTI Revenues per Segment 4Q22 versus 1Q23 (Fun Trading)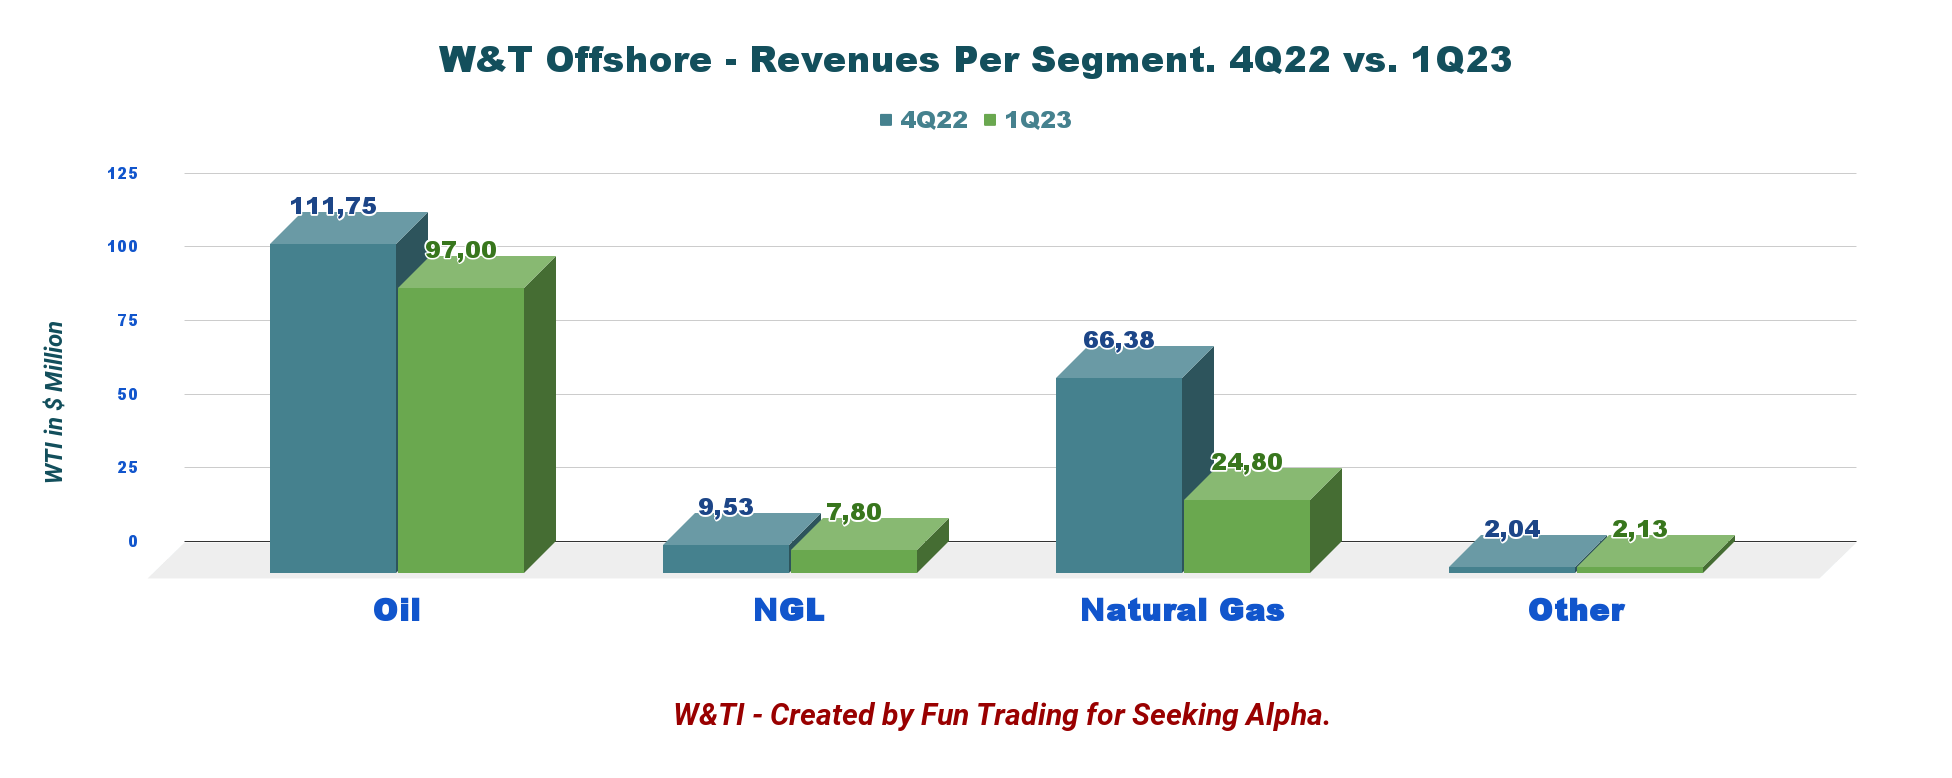
W&T’s average realized price per barrel of oil equivalent (“Boe”) before realized derivative settlements was $44.32 per Boe in the first quarter of 2023, a decrease of 16.1% from $52.82 per Boe in the fourth quarter of 2022.
Before realized derivative settlements, crude oil, NGL, and natural gas prices for the first quarter of 2023 were $71.85 per Oil barrel, $26.51 per NGL barrel, and $3.23 per Mcf.
Liquids (oil and NGL) represented 56% of the total production in the quarter.
WTI Quarterly Liquids and Production History (Fun Trading)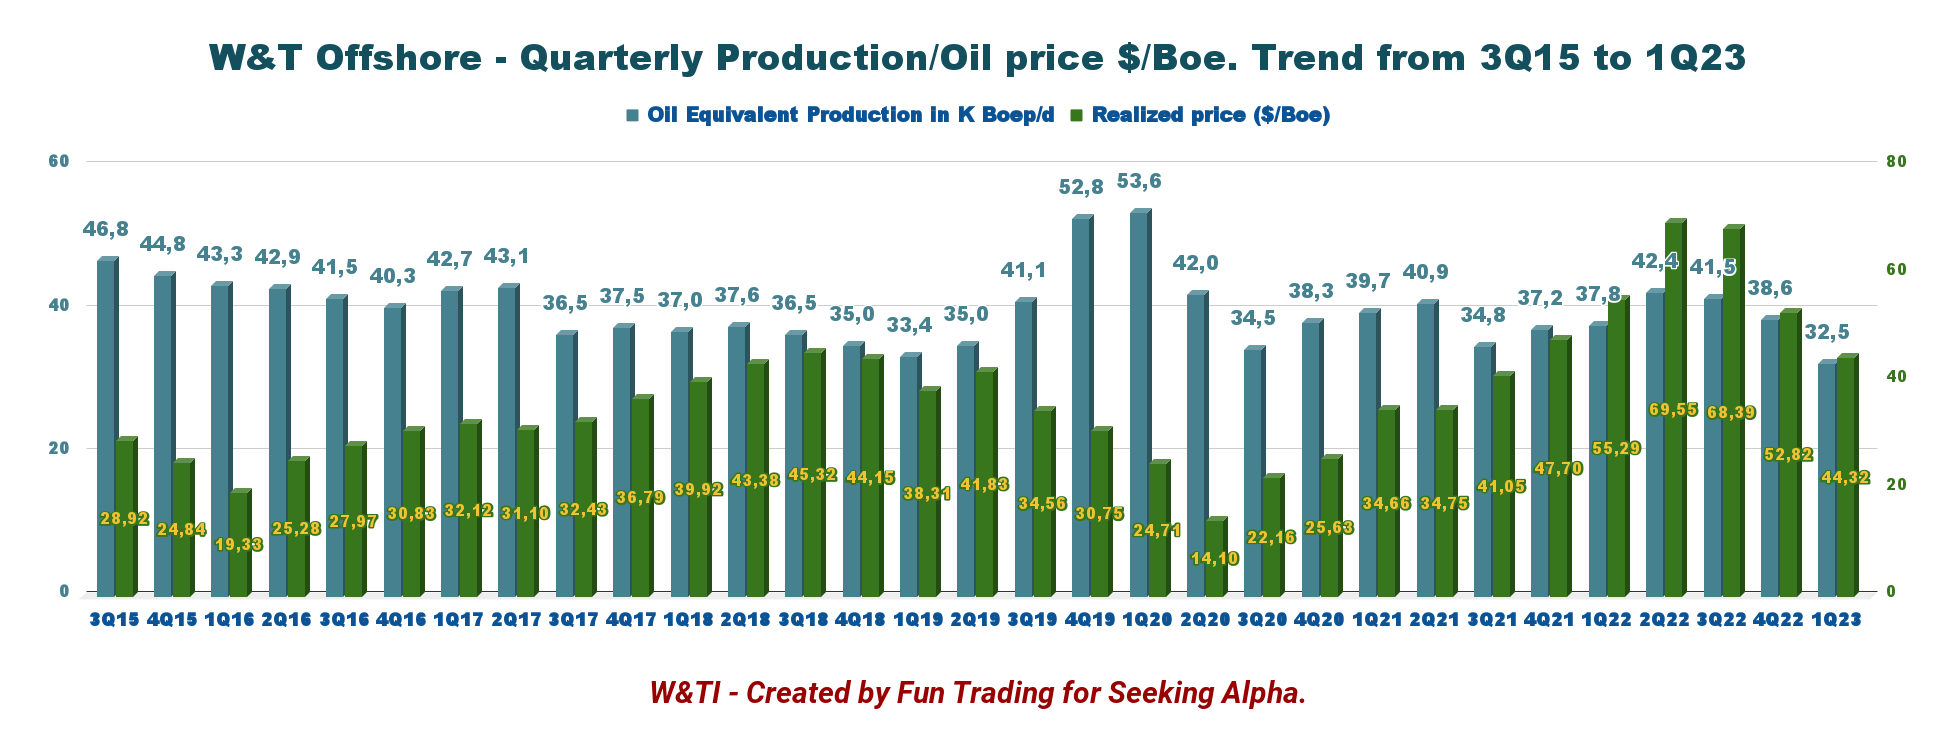
4 – Net debt was $225.9 million in Q1’23
WTI Quarterly Cash versus Debt History (Fun Trading)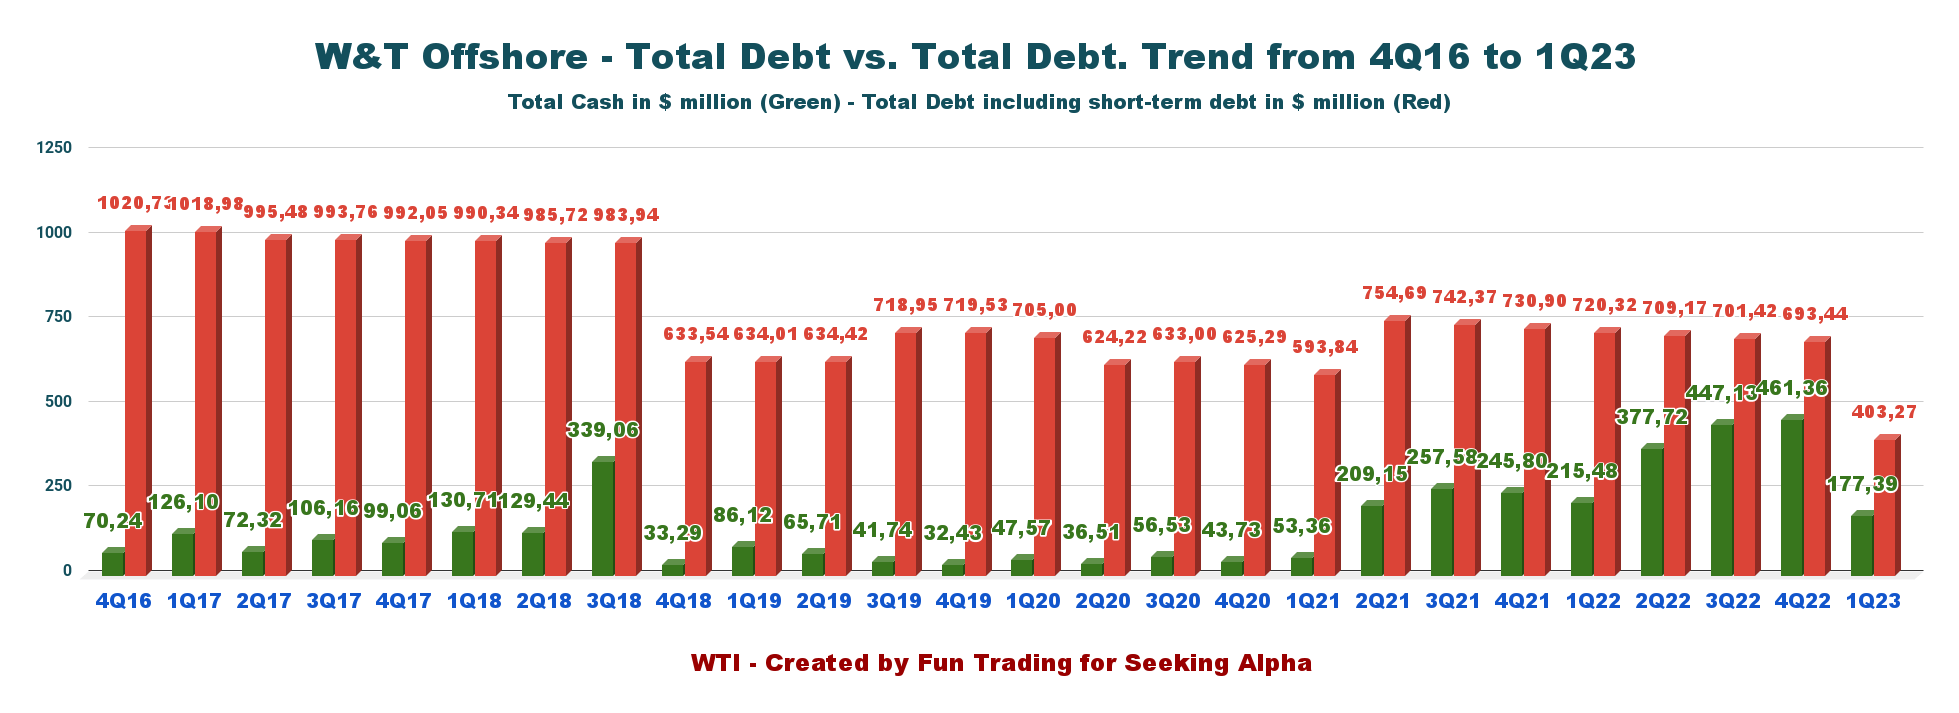
W&T had available liquidity of $275.9 million, comprised of $225.9 million in cash and cash equivalents and $50.0 million of borrowing availability under W&T’s first priority secured revolving facility provided by Calculus Lending LLC (“Calculus”).
On January 27, 2023, the company closed an offering of $275 million in aggregate principal amount of 2026 Senior Second Lien Notes at par in a private offering exempt from registration under the Securities Act of 1933, as amended.
WTI Balance Sheet (WTI Presentation)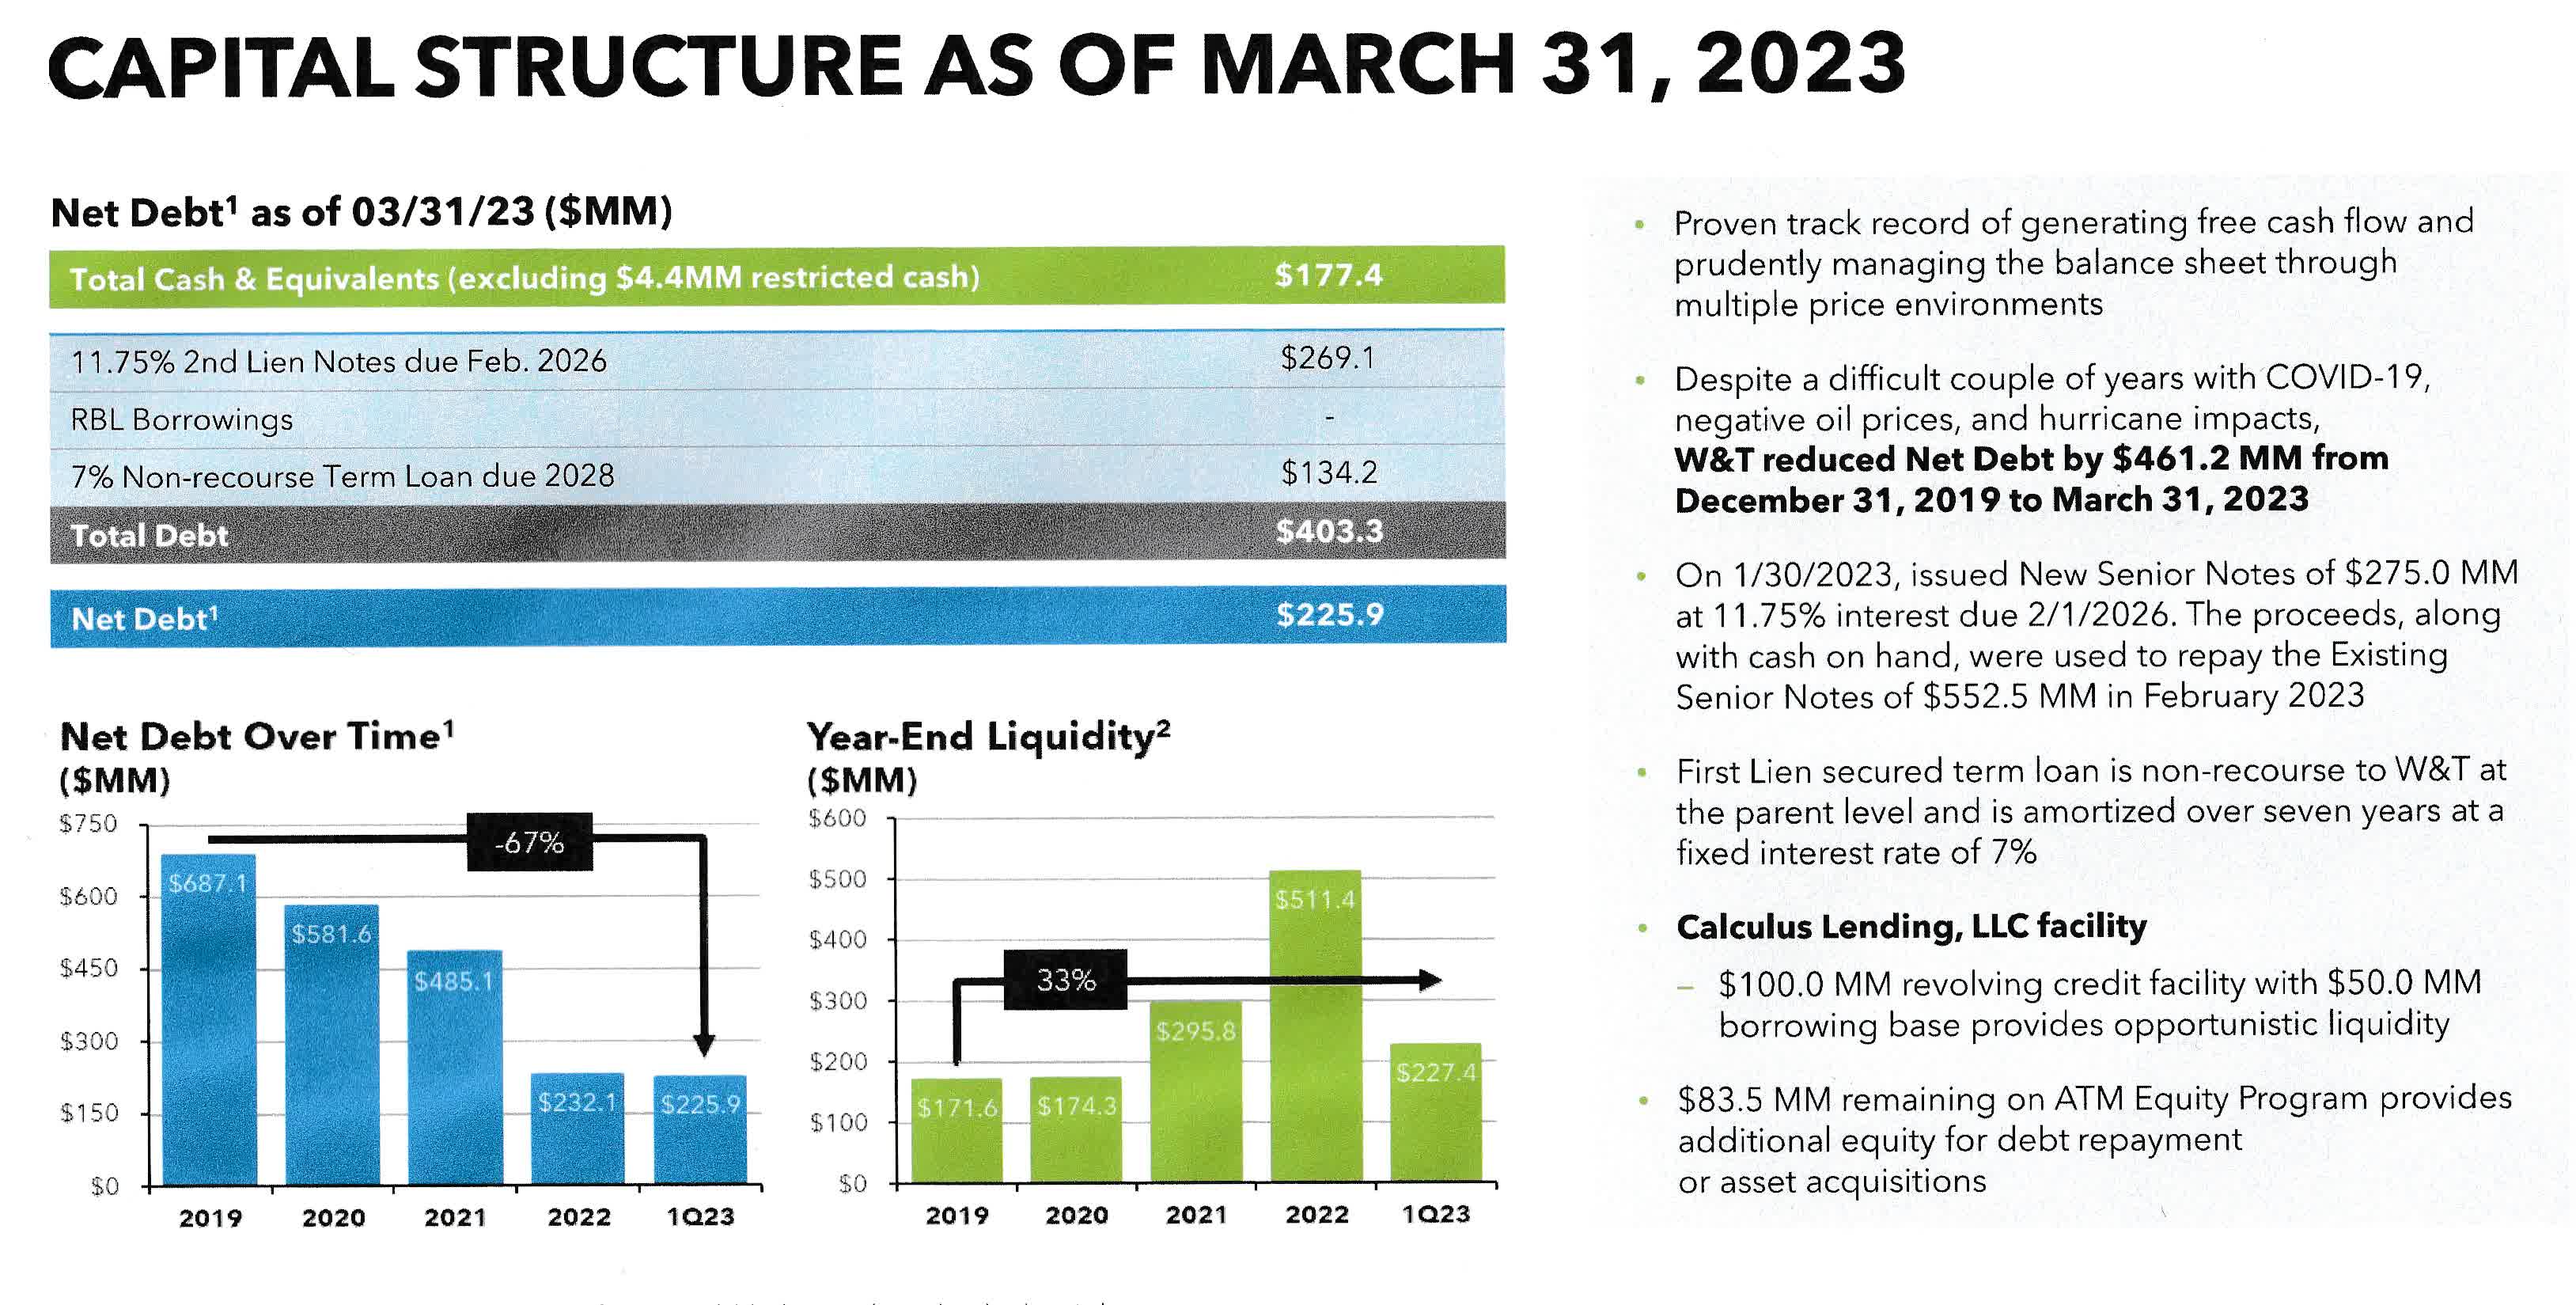
5 – Q2’23 Guidance
Production for the second quarter of 2023 is expected between 34.9K Boep/d and 39.1K Boep/d with a range of 37.0K Boep/d and 41.0K Boep/d for the full year 2023. Production for 2Q23 is expected to be up 13.8% compared with 1Q23 using the mid-point.
WTI 2Q23 Guidance (WTI Press Release)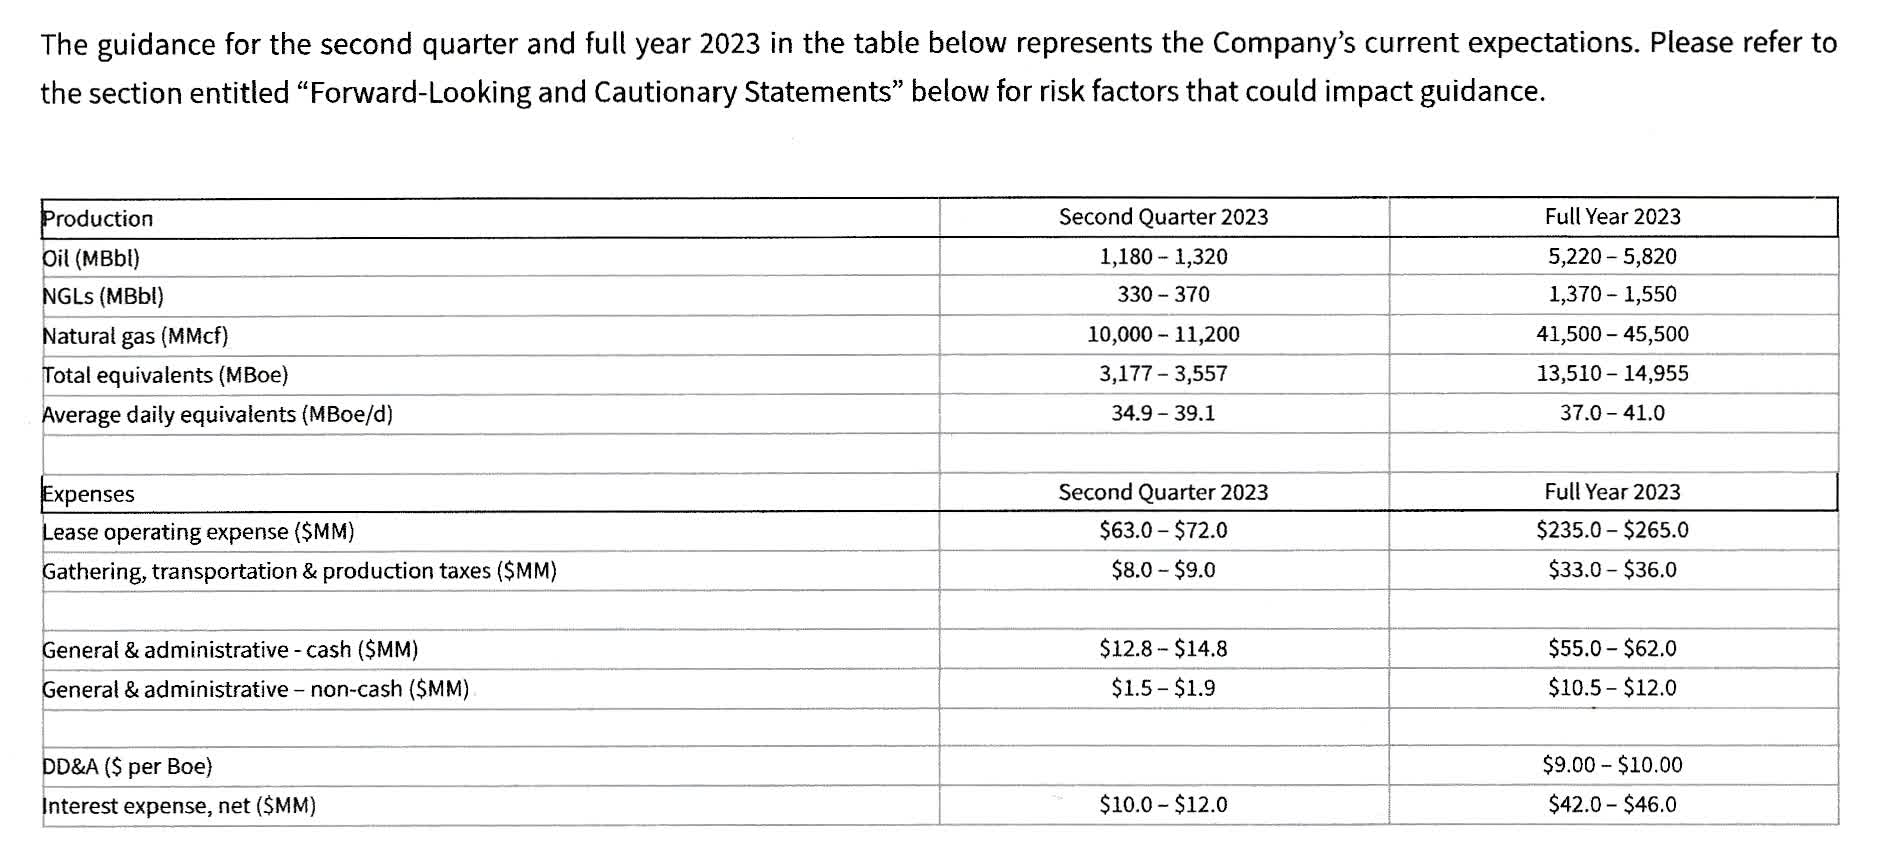
Technical Analysis And Commentary
WTI TA Chart Short-term (Fun Trading StockCharts)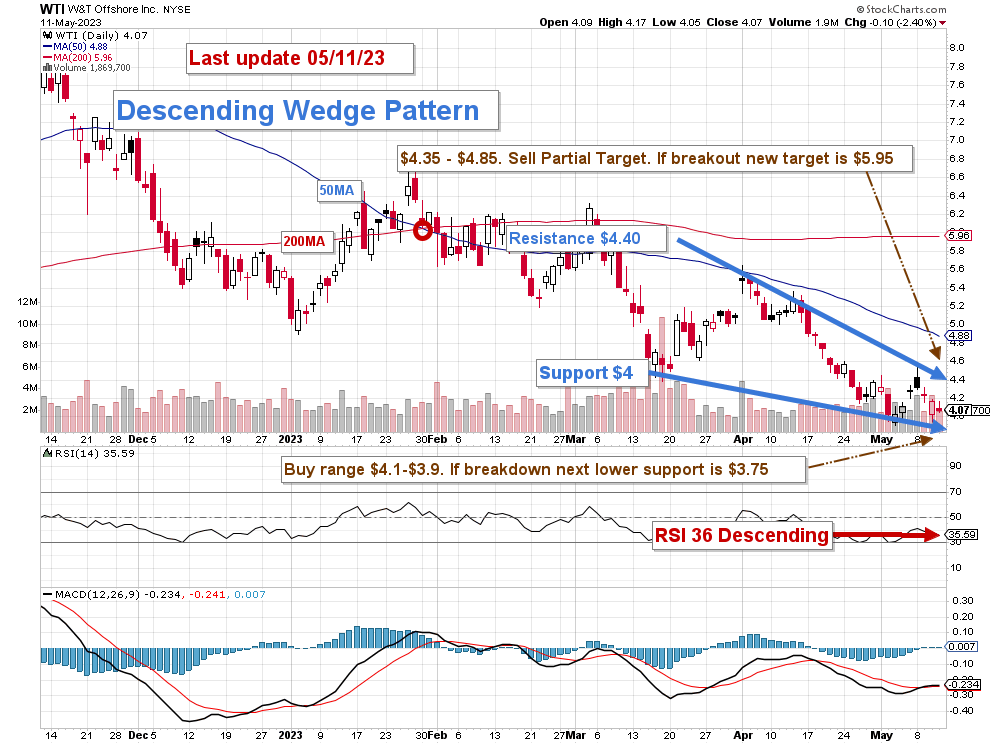
WTI forms a Descending Wedge pattern with resistance at $4.40 and support at $4.00.
The falling wedge is a bullish price pattern that represents a story about the market in which bulls are preparing for another push.
The short-term trading strategy is to trade LIFO about 55%-65% of your position and keep your core long-term amount for a potentially higher payday above the 200MA.
I suggest selling gradually between $4.35 and $4.85 with possible higher resistance at $5.95 and waiting for a retracement between $4.10 and $3.90 with possible lower support at $3.75.
Watch oil prices like a hawk.
Warning: The TA chart must be updated frequently to be relevant. It is what I am doing in my stock tracker. The chart above has a possible validity of about a week. Remember, the TA chart is a tool only to help you adopt the right strategy. It is not a way to foresee the future. No one and nothing can.