
Key points:
- Bitcoin has pulled back to the $76,000 level, a crucial near-term support level to watch.
- Several major altcoins have broken below their near-term support levels, indicating that the bulls have given up.
Bitcoin (BTC) came under pressure on Monday after US President Donald Trump warned Iran that the “clock is ticking” and they better get moving fast. Analyst CryptoRover said in a post on X that a potential US military operation against Iran “is extremely dangerous for $BTC.”
Institutional investors also seem to be turning cautious in the short term. According to SoSoValue data, spot BTC exchange-traded funds recorded $1 billion in weekly net outflows. That was the first net outflow after six successive weeks of inflows totaling $3.4 billion.
Crypto market data daily view. Source: TradingView
While several traders are cautious on BTC’s prospects in the near term, Michael Saylor’s Strategy, the world’s largest public Bitcoin holder, continued to buy BTC. Strategy purchased 24,869 Bitcoin for $2.01 billion between May 11 and 17, boosting its holdings to 843,738 BTC, per Monday’s 8-K filing with the US Securities and Exchange Commission.
Could BTC and the major altcoins bounce off their crucial support levels? Let’s analyze the charts of the top 10 cryptocurrencies to find out.
S&P 500 Index price prediction
The S&P 500 Index (SPX) rallied to a new all-time high of 7,517 on Thursday, where short-term traders booked profits.
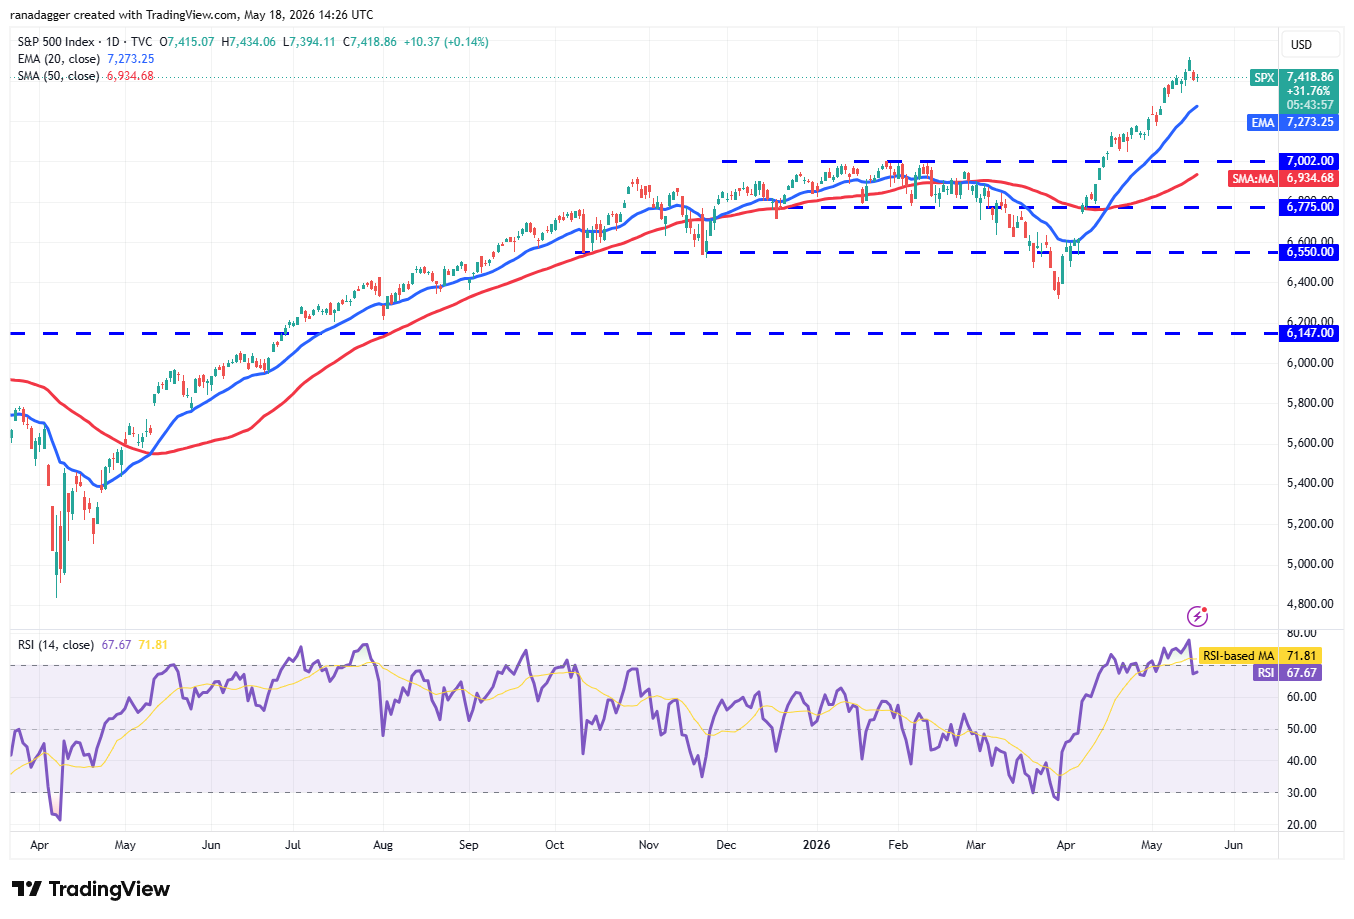
SPX daily chart. Source: Cointelegraph/TradingView
The index may pull back to the 20-day exponential moving average (7,273), a crucial support level to watch. If the price rebounds off the 20-day EMA with strength, it suggests a positive sentiment. That increases the likelihood of an uptrend resuming toward the 8,000 level.
Sellers will have to tug the price below the 20-day EMA to weaken the bullish momentum. If they do that, the index may witness a deeper pullback to the 7,002 level.
US Dollar Index price prediction
The US Dollar Index (DXY) turned up from the 97.74 support and broke above the moving averages.
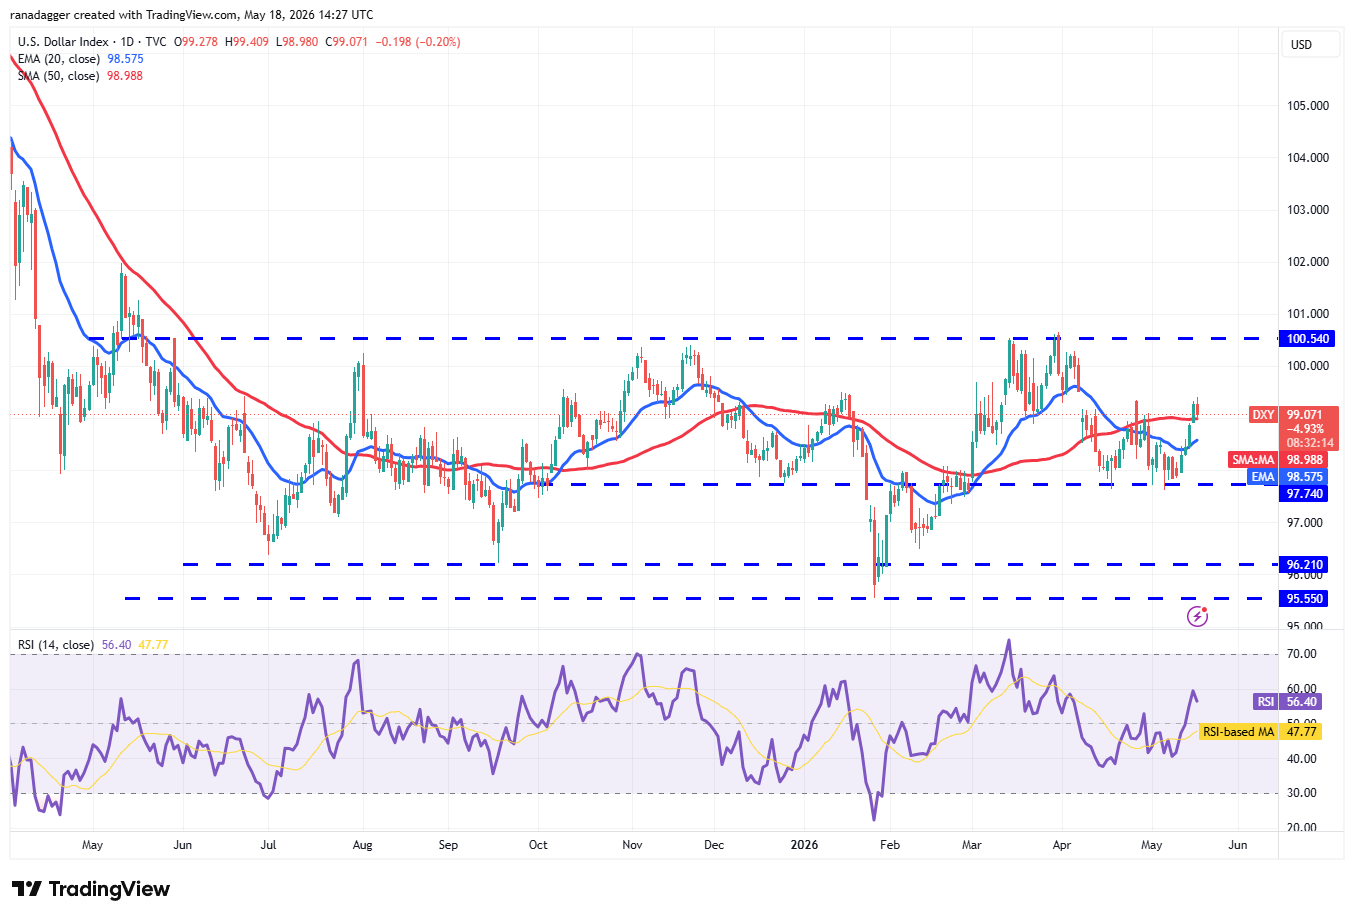
DXY daily chart. Source: Cointelegraph/TradingView
There is minor resistance at 99.34, but if the bulls sustain the price above it, the index may reach the stiff overhead resistance at 100.54. Sellers are expected to fiercely defend the 100.54 level, as a break and close above it would signal the start of a new uptrend. The index may then surge to 101.97.
Conversely, if the price turns down from the current level or from the 100.54 resistance and breaks below the 50-day simple moving average (98.98), it suggests that bears remain active at higher levels. That may keep the index range-bound between 97.74 and 100.54 for a few more days.
Bitcoin price prediction
BTC continued its slide and has reached the 50-day SMA ($75,627), suggesting bears are attempting to take charge.
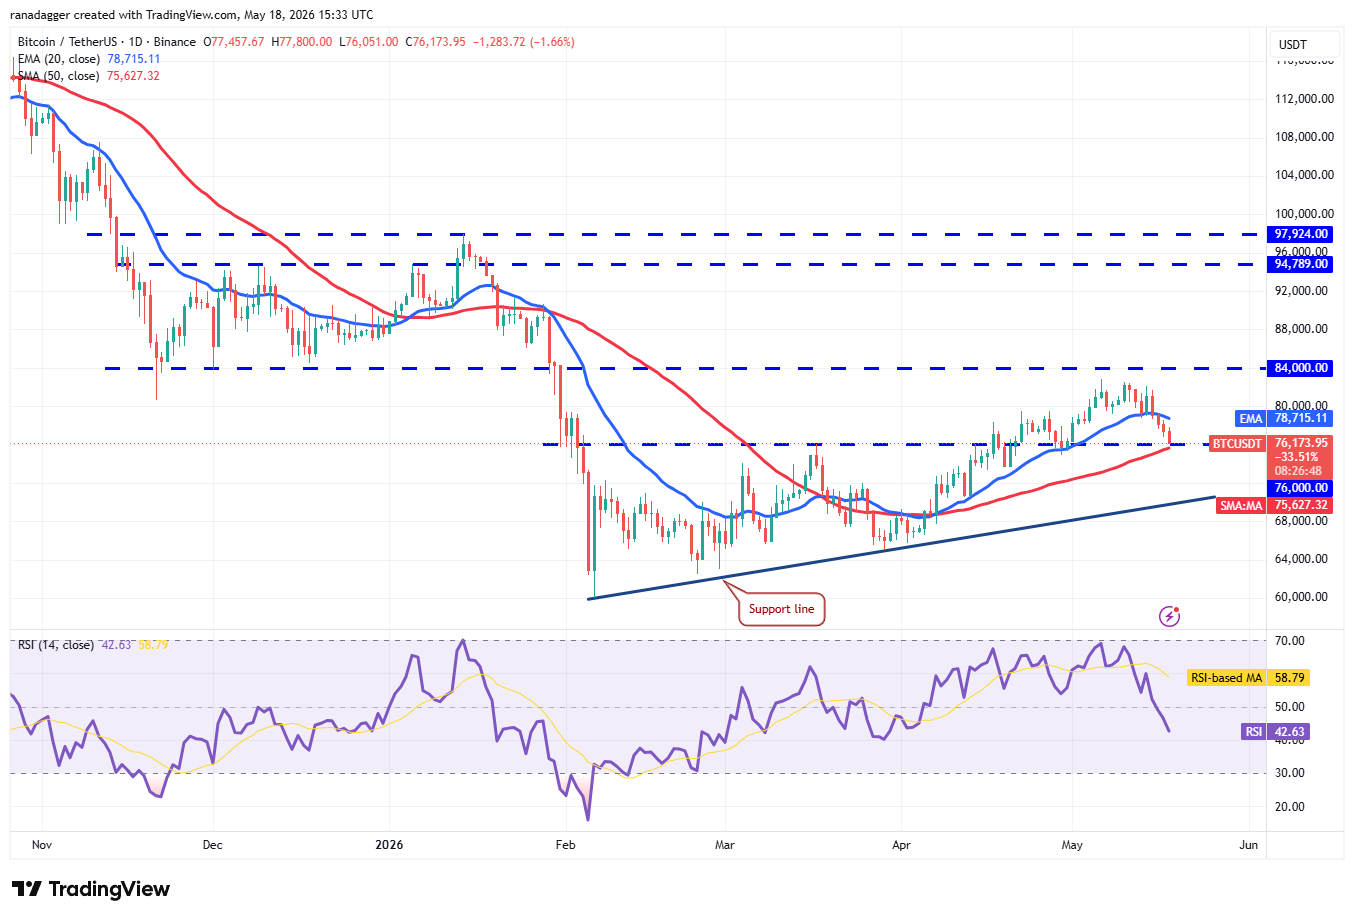
BTC/USDT daily chart. Source: Cointelegraph/TradingView
Buyers will have to sustain the BTC price above the 50-day SMA to retain the advantage. The first sign of strength will be a close above the 20-day EMA ($78,715). That opens the door to a rally toward the $84,000 resistance.
Instead, if the price closes below the 50-day SMA, it increases the risk of a drop to the support line of the ascending channel pattern. Buyers are expected to vigorously protect the support line, as a break below it may sink the BTC/USDT pair to $65,000.
Ether price prediction
Ether (ETH) continued its downward march and closed below the support line of the ascending channel pattern on Sunday.
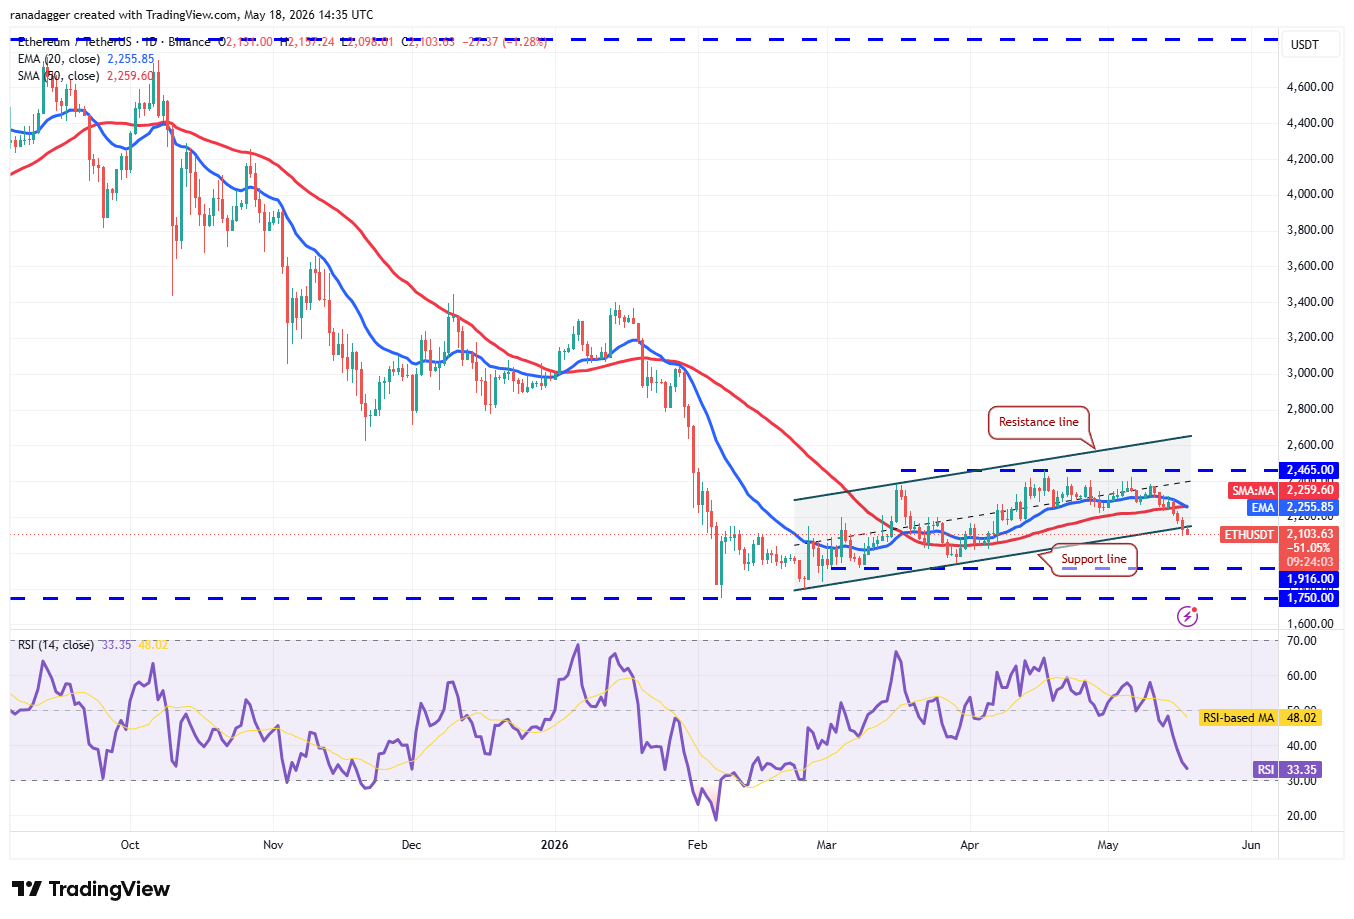
ETH/USDT daily chart. Source: Cointelegraph/TradingView
The 20-day EMA ($2,255) has begun to turn lower, and the RSI is near oversold territory, indicating that bears are in control. Any recovery attempt is expected to face selling at the 20-day EMA. If the ETH price turns down sharply from the 20-day EMA, the likelihood of a drop to $1,916 increases.
Buyers have an uphill task ahead of them. They will have to drive and maintain the ETH/USDT pair above the moving averages to signal a comeback.
XRP price prediction
XRP (XRP) has dipped below the 50-day SMA ($1,39), indicating that the bears are attempting to gain the upper hand.
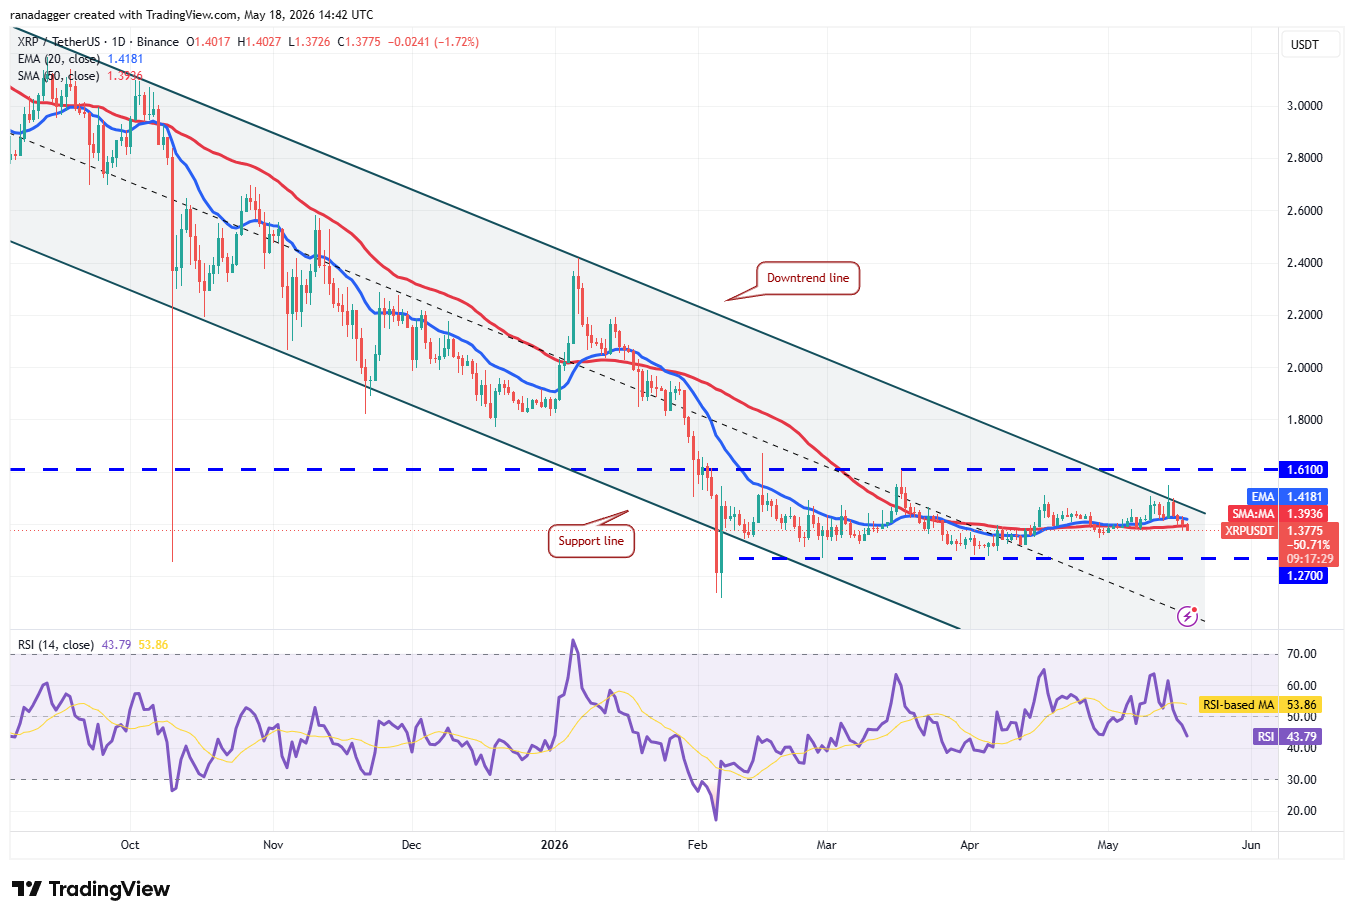
XRP/USDT daily chart. Source: Cointelegraph/TradingView
If the price closes below the 50-day SMA, the next likely stop is the solid support at $1.27. Buyers are expected to defend the $1.27 level with all their might, as a close below it may sink the XRP/USDT pair to $1.11 and later to the psychological level at $1.
Buyers are expected to face selling at the downtrend line and then at the $1.61 level. A break and close above the $1.61 resistance signal a short-term trend change. The XRP price may then march to $2 and subsequently to $2.40.
BNB price prediction
BNB (BNB) pulled back from the $687 overhead resistance and broke below the 20-day EMA ($648).
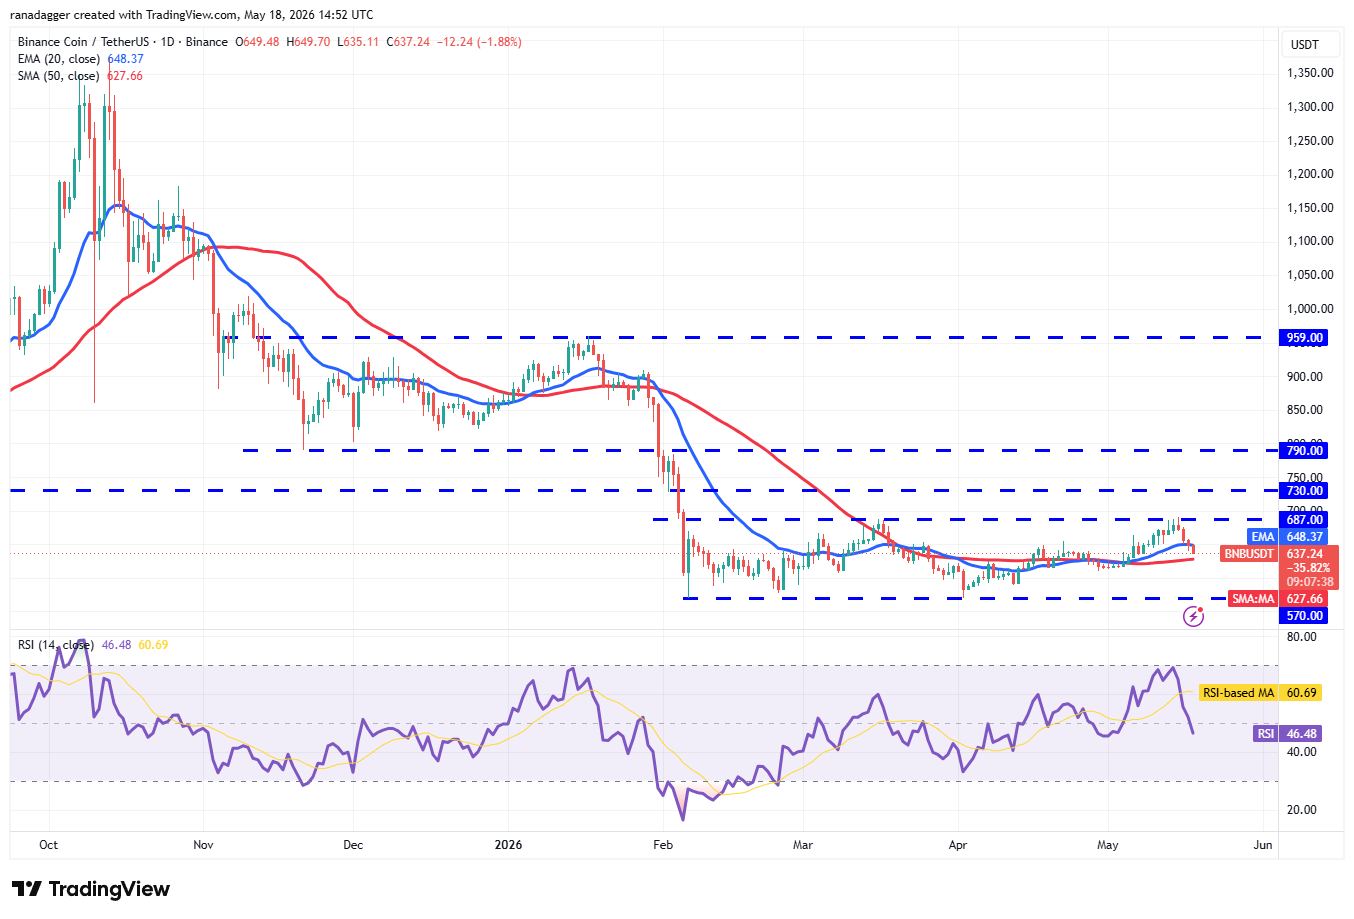
BNB/USDT daily chart. Source: Cointelegraph/TradingView
There is minor support at the 50-day SMA ($637), but if the level cracks, the BNB/USDT pair may plummet to the solid support at $570. This is a crucial level to watch out for, as a close below $570 indicates the start of the next leg of the downtrend. The pair may then collapse toward $500.
On the contrary, if the BNB price turns up from the 50-day SMA, it suggests demand at lower levels. Buyers will have to thrust the price above the $687 resistance to indicate strength. The pair may then rally to $730 and then to $790.
Solana price prediction
Solana (SOL) closed below the 50-day SMA ($85) on Sunday, indicating that the bears are on a comeback.
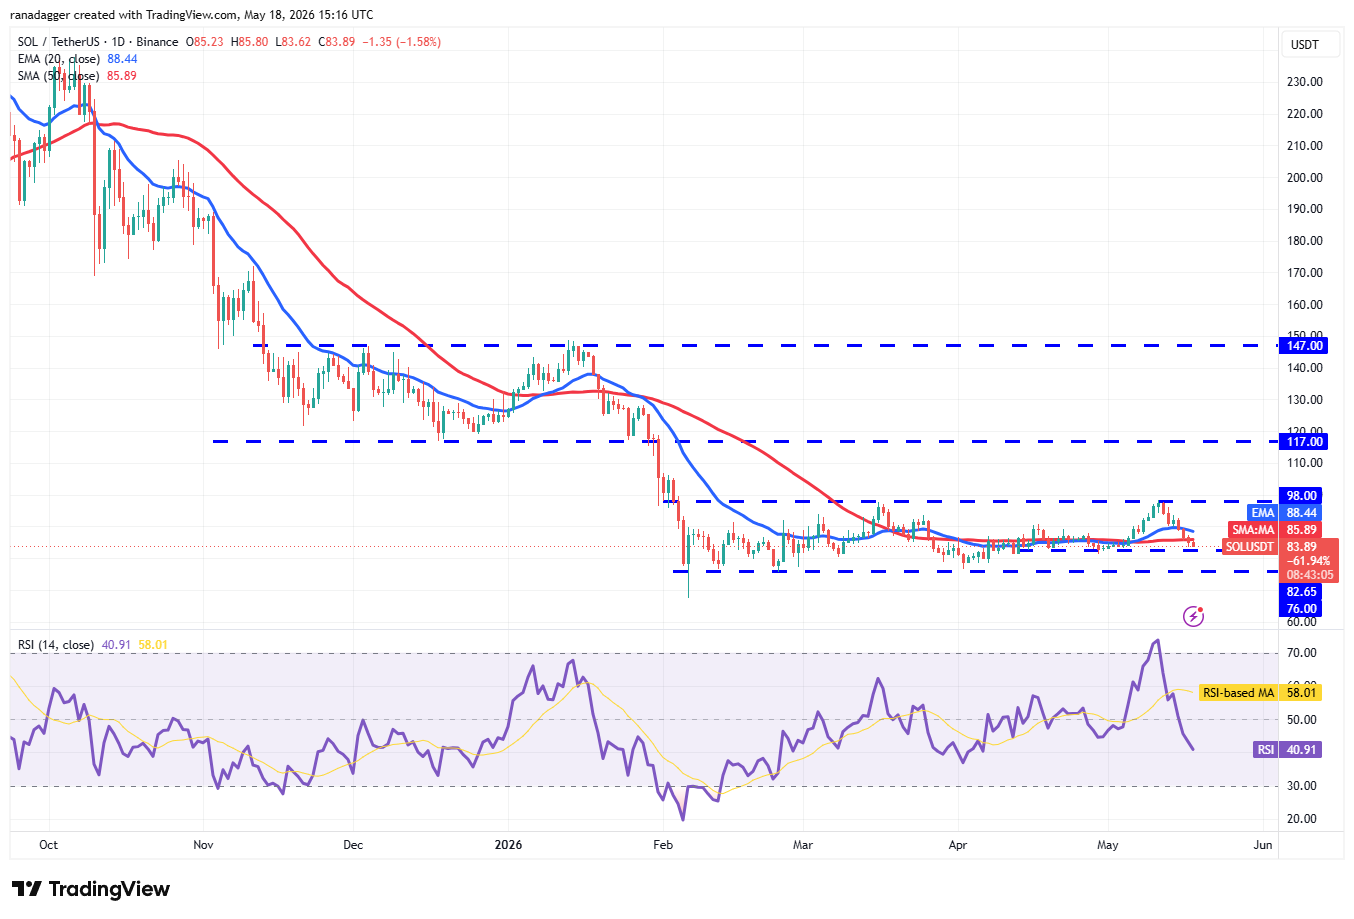
SOL/USDT daily chart. Source: Cointelegraph/TradingView
There is support at $82, but the recovery is expected to face selling at the 20-day EMA ($88). If the SOL price turns sharply down from the 20-day EMA, the likelihood of a break below the $82 support increases. That opens the doors for a drop to the $76 level.
The first sign of strength will be a close above the 20-day EMA. That shows solid buying at lower levels. The bulls will be back in the driver’s seat after the SOL/USDT pair closes above the $98 resistance.
Related: Hyperliquid eyes 55% price rise after Silicon Valley investor’s ‘massive HYPE buy’
Dogecoin price prediction
Dogecoin (DOGE) has dipped below its 20-day EMA ($0.11), suggesting that bulls have given up in the short term.
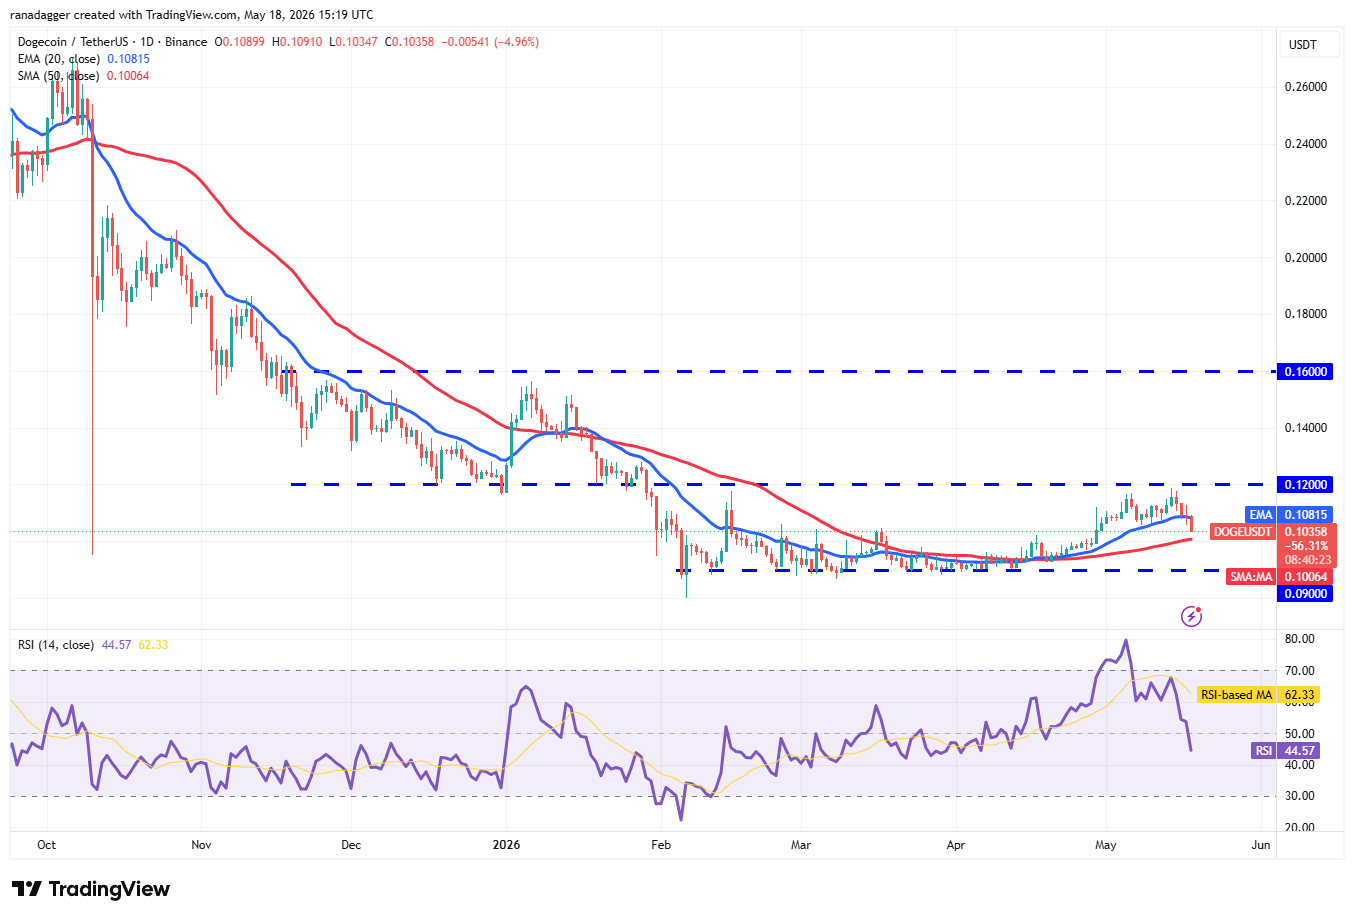
DOGE/USDT daily chart. Source: Cointelegraph/TradingView
The flattish 20-day EMA and the RSI just below the midpoint suggest a range-bound action between $0.09 and $0.12 for some more time.
Buyers will have to push and sustain the DOGE price above the $0.12 resistance to signal the start of a new up move. The DOGE/USDT pair may then climb to $0.14 and later to $0.16.
On the downside, a break and close below the $0.09 support indicates the resumption of the downtrend. The pair may then slump to $0.08.
Hyperliquid price prediction
Hyperliquid (HYPE) has been volatile for the past few days, indicating a tough battle between the bulls and the bears.
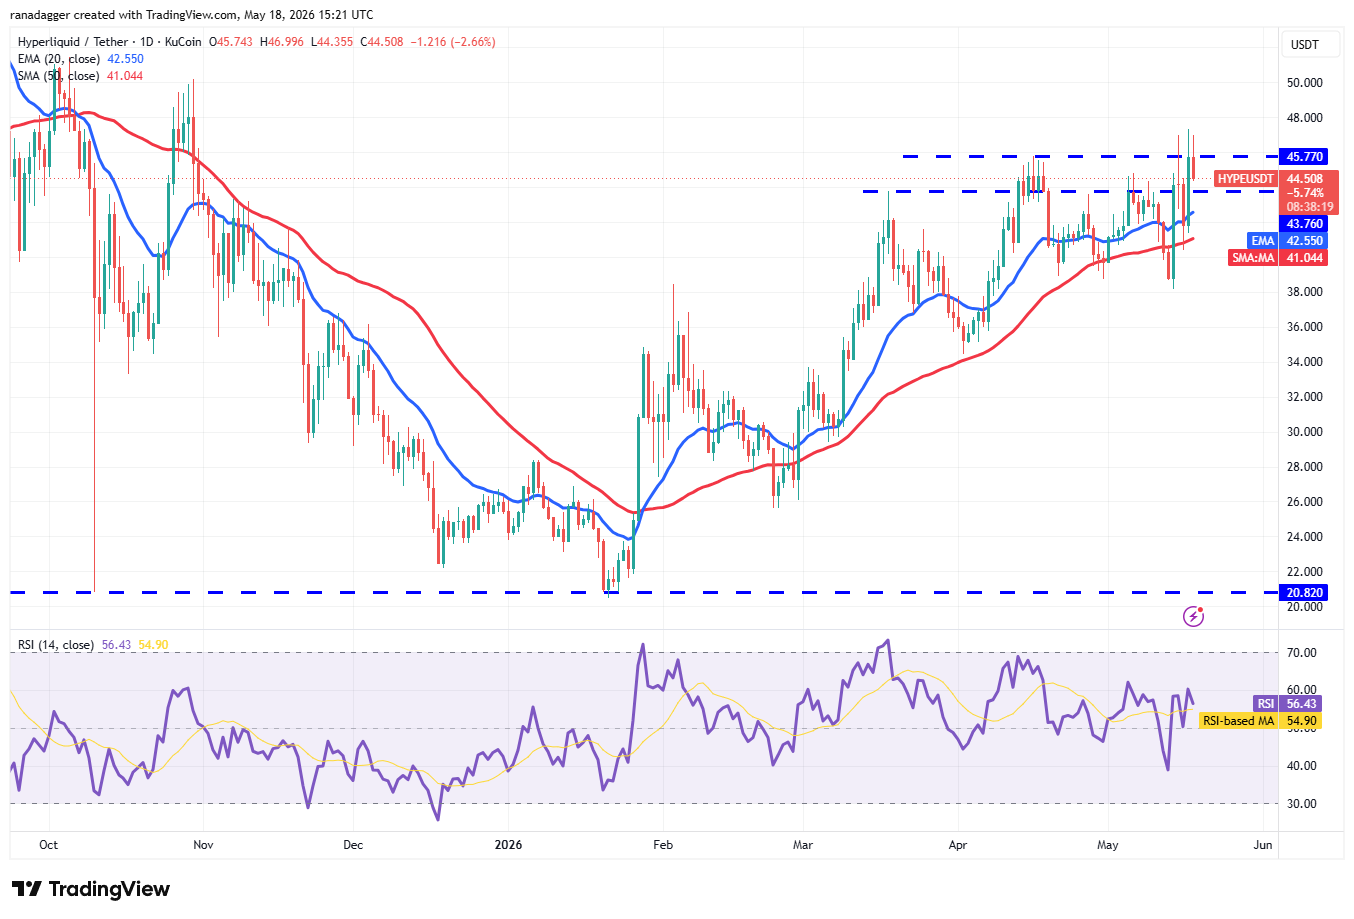
HYPE/USDT daily chart. Source: Cointelegraph/TradingView
The bulls pushed the HYPE price above the $45.77 resistance, but the long wick on the candlestick shows selling at higher levels. Buyers will have to secure a close above the $45.77 level to clear the path for a rally to the $50 to $51.43 zone.
The 20-day EMA ($42.55) is the critical support to watch out for on the downside. A break below it suggests that the HYPE/USDT pair may consolidate inside the $38.17 to $47.32 range for a while.
Cardano price prediction
Cardano (ADA) has dipped below the 50-day SMA ($0.25), indicating that the bears continue to exert pressure.
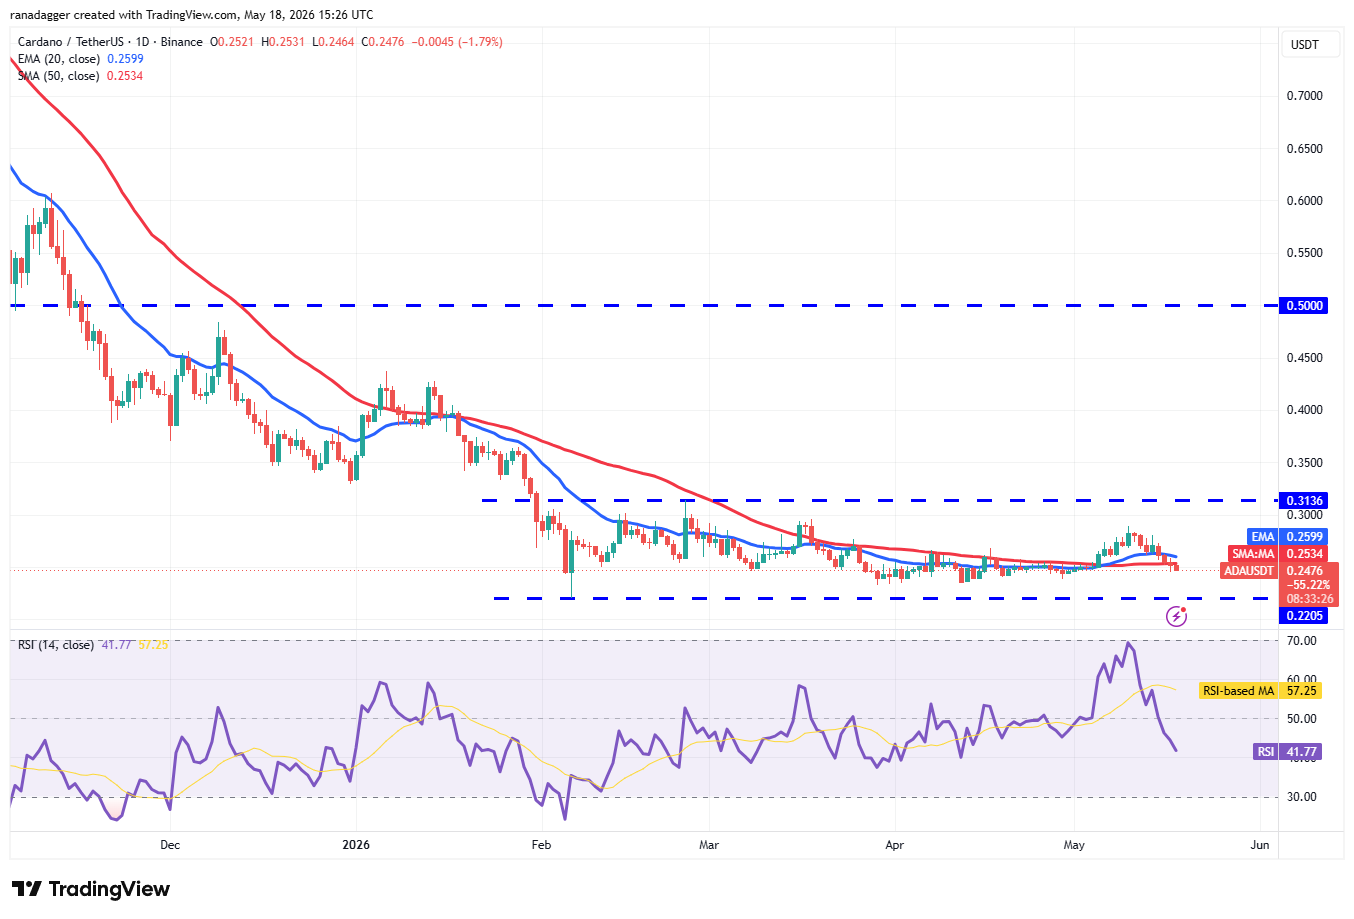
ADA/USDT daily chart. Source: Cointelegraph/TradingView
The flattish moving averages and the RSI just below the midpoint suggest the ADA/USDT pair may oscillate inside the $0.22 to $0.31 range for a few more days.
The next trending move may begin on a close above the $0.31 resistance or below the $0.22 support. If the ADA price turns up and breaks above $0.31, the pair may pick up momentum and soar toward $0.40. Alternatively, a close below $0.22 signals the resumption of the downtrend toward the target objective of $0.13.